6 ways IoT will make local search for SMBs scalable

dgdgdfg

hjhgjfg


See details of post 6 ways IoT will make local search for SMBs scalable below

In an age of artificial intelligence (AI), the Internet of Things (IoT) may seem like yesterday’s news, but, of all the technologies currently developing, it has the greatest potential for near-term changes that affect local search.

While it remains murky how AI will benefit agencies, IoT is reaching a critical point in adoption and maturing to a stage where it provides actionable data. Or, as Brian Buntz with the Internet of Things Institute stated, “The IoT is about to shift into ludicrous mode.”

The growth of the IoT is spurred by decreasing costs of hardware, such as sensors, together with the ease and availability of wireless connectivity. IoT devices already outnumber smartphones by about four times, and growth is expected to accelerate further with Cisco estimates topping 50 billion devices by 2020. The amount of data generated by these devices is enormous.

Growth in the Internet of Things

Source: Cisco

Annual global IP traffic already exceeds 1 zettabyte of data and will double by 2019, Cisco forecasts. What is a zettabyte? It’s 1 billion terabytes. Or 1,000 exabytes. One exabyte amounts to 36,000 years of HD video, the company says. And Cisco adds, if a small (or a tall, for you Starbucks drinkers) coffee represented 1GB, a zettabyte would equate to a volume of coffee the size of the Great Wall of China. That’s a lot of data.

Back in 2014, Cisco’s CEO pegged the IoT as a $19 trillion market opportunity that will almost certainly change the way consumers do pretty much everything, from working to driving to shopping to exercising, and many other things.

And a subset of IoT, the location of things market — which enables connected devices to monitor and communicate their geographic location — is expected to reach $72 billion by 2025, according to Grand View Research. With location being the heart of local search, IoT will impact local search and search marketing in profound ways. But it goes beyond location.

According to Goldman Sachs, there are five main IoT verticals of adoption: wearables, connected cars, connected homes, connected cities and industrial internet. The first three are those most relevant to search, as they are related to consumer intent and behavior.

ey verticals of adoption - IOT

Source: Goldman Sachs

The SMB scale issue

Servicing local businesses with small budgets has always been a challenge for agencies. It’s too much work for too little money. It’s also expensive for SMBs who don’t enjoy the scale that larger businesses benefit from when purchasing search advertising or other marketing services. Both of which lead to the high churn rates at agencies that service SMBs.

Even though search boasts the ability to know the intent of users through keyword searches and display relevant advertising in response, it still has inefficiencies that are magnified for SMBs. Understanding user intent is largely dependent on how accurately the user can express his or her needs in typical keywords.

Let me illustrate with a personal example. I recently replaced an electric cooktop in my kitchen with a gas one. But the electric cooktop used a unique 50 amp plug. Instead of hiring an electrician, I wanted to see if there was an adapter that would convert that 50 amp socket into one that would fit the standard 15 amp plug that my gas cooktop used.

Gas range adapter vs RV plug adapter

What I needed (Gas Range Adapter) vs. What I got (RV Plug Adapter)

I must have conducted a dozen searches of varying terms describing what I wanted. I was repeatedly served search ads of products that seemed to be what I was looking for. But all the products advertised did just the opposite — converted a 15 amp socket for a 50 amp plug — an issue I discovered was common to RV hookups. I finally found a product conveniently called a gas range adapter. It seems obvious now, but, since I didn’t know the name for it, I wasted a lot of time, and more importantly, clicks on irrelevant search ads.

Consumers with experiences like mine may be why so many SMBs stop buying SEM services. But if search engines and advertisers had had more data about me and about my recent offline behavior, this problem might have been avoided, and I could have been served up information that was relevant to my needs.

Better data — which IoT can deliver — will both improve the consumer experience and result in better returns from marketing for SMBs. With better ROI, SMBs can better justify spending money on hiring agencies, and agencies can spend more time doing the job right. Data will also produce better results with automated processes like programmatic ad buying, reducing time and cost for agencies.

What kind of data are we talking about?

Current data use in targeting and retargeting is just the tip of the iceberg compared to how IoT will change the landscape. It appears nothing is off-limits when it comes to connectivity. Connected products being developed include mascara, contact lenses and ink for tattoos.

Simple applications would already be improvements over former or current uses. For example, location information can be enhanced by real-time data from wearables such as clothing, shoes or smart watches that indicate speed, and thus, whether the user is passing by in a vehicle or walking down the street. And, if the user is walking, it could indicate whether the person is walking for exercise, at a pace to get to a destination or at one that would indicate window shopping. Multiple location devices on a consumer are also more likely to interact with on-site location devices such as beacons and WiFi and help improve location accuracy.

Another area of significant growth for IoT is health care. Devices like contact lenses, implants, wearables or tattoo-like connected ink can track sweat composition and body chemistry, measure blood flow and glucose levels, or even determine whether you’ve taken medication. Lack of adherence to medical prescriptions is estimated to cause 125,000 deaths and at least 10 percent of hospitalizations, making such devices arguably medically necessary.

Home connected devices — including lights, appliances, thermostats, vacuums, pillows, TVs, lawnmowers, video cams, voice assistants, scales and security systems — capture behavioral data in the home as never before.

Examples of IoT devices

Examples of IoT Devices

But the potential lies in the way data from multiple devices may be integrated to tell a deeper story. Envision knowing the sleep habits of a consumer such as:

  • how soundly they sleep.
  • what body triggers occur before they wake up.
  • how many times they get up at night and turn on the lights.
  • whether they turn the TV on.
  • how that sleep varies based on the temperature of the room.
  • whether the chip-tagged cat climbing onto the bed triggers minor allergies that wake the homeowner.

The potential for insight into consumer behavior and responding with timely information is limited only by imagination. Yet the impending impact is already something agencies and SMBs can plan for. Below I take a look at six ways IoT will boost the ROI of search marketing for SMBs, making it a much broader and viable option.

6 ways that IoT will make local search scalable for SMBs

1.Boost search ads through improved targeting

Good data will make targeting the right person at the right time more accurate. Multiple GPS-connected devices per person provide additional location data for tracking users with greater accuracy and additional IoT data will provide deeper insight into needs and behavior.

For example, your wearable knows you just worked out and are hot and thirsty, based on your sweat readings. Your car knows there is a 7-Eleven two blocks ahead on your right where you can swing in quickly. And your phone can read you a notification on a 99-cent deal for a large cold slushy drink at that location which is good for 10 minutes. You pull in, and the coupon is location-triggered and automatically applied to your credit card when you pay.

2. Customer data becomes the new competitive edge

Large buyers of marketing services gain a competitive edge in scale by spreading costs over a large volume of interactions or leads. That lowers cost per lead. Smaller local businesses often don’t have that luxury, but good IoT data that improves the conversion of leads means that you can get more customers even when buying fewer leads. So the cost per customer goes down.

Ultimately, having the right customer data — rather than scale — is the new competitive edge.

3. Identify real-world offline behavior that drives online action

Knowing more about a person’s habits or preferences isn’t just about being able to target them directly. That data, when aggregated for many other individuals, reveals trends and predictability for targeting strategies. SEL’s sister publication, Marketing Land, recently published an interview with PlaceIQ CEO Duncan McCall, who explained that offline data on user location and behavior is a better indicator of intent than online signals.

In other words, knowing real-life choices, actions and behavior predicts online decisions better than clicks, search history and page views. Presumably, this is because the offline behavior is a deeper and more complete picture of the real world, at least until we live in a Matrix-like AR universe.

And that type of data is exactly what IoT devices collect and measure. The data can provide some surprising audience insights. Data from targeting platform NinthDecimal revealed that fast-food patrons were not the best targets for a quick-service restaurant campaign. Rather, DIY enthusiasts, moviegoers and leisure travelers were better targets.

4. Boost data sharing and overcome privacy concerns with services consumers want

There’s a great concern, especially with companies that have business in Europe, over evolving privacy laws. Europe’s GDPR (General Data Protection Regulation), which takes effect in May 2018, limits use of a person’s data unless express consent is given.

The way to overcome that limitation is to provide a product or service that the user values more than the information he or she is releasing. For example, a company called Mimo makes onesies for infants that measure breathing, sleep movements and other sensitive data. But concerned parents gladly turn that information over to the company in return for protection against SIDS or improved sleep routines.

Roomba, the maker of robotic vacuums, uses maps of your home to improve the overall user experience. The inside of your house seems like something most wouldn’t want to share, but consumers routinely choose convenience over privacy. If data sharing will make your vacuum perform better and get your house cleaner, many users will agree to it. Data might be shared with Amazon or Apple to link the device to your Echo or to Siri. It may link to any of a number of smart home devices made by Google (Nest), Samsung (appliances) or a flooring company or a retailer that carries Roomba-friendly furniture.

However, the GDPR prohibits making provision of a service conditional upon release of data if that data is not necessary to the service. While not law in the US, there certainly are discussions over similar privacy concerns. Yet again, providing related benefits in return for the data can solicit “freely given consent.”

For example, I recently installed a Honeywell WiFi connected thermostat in my home. Honeywell has since emailed me to offer a software upgrade that will optimize my thermostat settings to help save me money and states that customers save $71-$117 a year on their energy bills by enrolling in the program. I get customized reports with insights into my energy use, comparison to similar homes and tips to help track and improve energy efficiency. I’m sure those “tips” will include some referrals to vendors such as insulation companies, solar energy vendors and HVAC contractors. But I’ll likely opt in to save a few bucks.

5. Level the playing field in access to big data

One of the complaints about privacy regulations is that they favor the big players that have sufficient leverage to get consumers to consent to handing over their data. Not many opt out of using Google Maps because they don’t want to share their location data, whereas smaller lesser used apps are easier to say “No” to.

Apple is also limiting ad tracking and frustrating ad buyers, but since its revenue is not advertising-dependent, it doesn’t really care. Those restrictions hurt advertiser conversions, make retargeting less effective and reduce reach. Meanwhile, Google is beginning to block “annoying” ads in its Chrome browser, further demonstrating that decisions made by a few big players can have a lot of impact.

The explosion of IoT devices means a lot more players in the data supply chain that provide quality first-party data and widen the narrow funnel controlled by a few major players. With data being the new competitive edge, that’s a great thing for ad buyers.

For example, in my Honeywell thermostat example, ad buyers can target users directly through Honeywell’s communications to its customers, or Honeywell can use its customer data to match and target users within other third-party media outlets such as Facebook or Bing.

6. Overcome ad blocking

Ad blocking occurs because users are tired of being served ad content they don’t want. However, there are repeated studies that show users are receptive to targeted or relevant advertising.

Verve shared a study called “The Rise of Mobile Prodigies” at LSA’s Place Conference that demonstrated that young consumers want ads to be tailored to their interests, hobbies, habits and location. Forty-six percent of them even saved ads they found innovative to revisit at a later time.

InMarket shared a case study at the same event showing a 2.3x lift in purchase intent, as well as 100 percent positive social media reaction to ads they created for ProYo, a protein-rich ice cream product.

see more here


    The Metrics Every E-Commerce Store Should be Tracking to Drive Growth

    this is a blog post on The Metrics Every E-Commerce Store Should be Tracking to Drive Growth.

    Be sure to read the full blog post and view the main source

    The most successful online stores winning at e-commerce are doing so because they’ve become absolutely obsessed with metrics. They swim in data.

    Every marketing and promotional decision is driving by the data. Because without data you have virtually no chance at making improvements. You don’t know what’s working, what’s failing, or even what success looks like.

    Driving growth in your e-commerce business requires a few key components:

    • Setting measurable goals (key performance indicators)
    • Identifying the metrics necessary to track those KPIs
    • Monitoring performance and making adjustments as necessary

    While there are numerous metrics that can be tracked, I’ve listed the ones most commonly tied to the growth of your store.

    Segmented Conversion Rate

    Your conversion rate is a pretty cut and dry metric. It’s the percentage of the visitors on your website who decide to make a purchase.

    It’s calculated by taking the total number of website visitors who make a single purchase and dividing that number by the total number of people who visit your site.

    For example; 14 customers made a purchase among 150 visitors, so the conversion rate (14 divided by 150) is 9.3%.

    Your conversion rate is a good overall indicator of success, but don’t stop there.

    If you break it down and segment your conversion rate you can get a lot more granular with the data, giving you tremendous insight into individual campaigns you’re using to grow your business.

    A few ways to segment your conversion rates include:

    1. Conversion by traffic source

    Reviewing how customers convert based on the traffic source (Google, Bing, Facebook, Reddit, etc.) can tell you where you should be investing in driving traffic, or what channels to focus on improving the targeting or message you’re using for campaigns.

    2. Conversion by device type

    Mobile devices accounted for 19% of US retail e-commerce in 2014, and that’s expected to climb to 27% by the end of 2018.

    The traffic coming from mobile is much higher. According to Yotpo, mobile accounts for more than half of all e-commerce traffic.

    Image Source

    If there’s a growing or uncommon gap in desktop and mobile conversion where one is outperforming another, review the user experience and see where improvements can be made.

    3. Conversion of new vs. returning visitors

    Keep in mind that conversions for returning visitors are traditionally higher because those customers already know you, trust your brand, and are more willing to make a purchase.

    For example; if your returning visitors are converting at ~7% but your new customers are converting at ~2% then the average is going to fall somewhere around 5%. If you use that average to calculate your max budget for acquisition campaigns that actually convert at ~2% you’re going to lose money.

    Segmenting these conversions can help you more accurately calculate what you should be spending on your acquisition campaigns and how well they’re performing.

    Segmented Revenue

    You should segment your revenue the same way you segment conversions. This loops back very well to tracking your conversions by traffic but you can get just as granular with segmenting your revenue.

    Like conversions, you can weed out sites that are just giving you a spike of eyeballs but aren’t really contributing anything to your bottom line.

    Image Source

    There’s a pretty clear difference in revenue by the sources in the example above. Note the one referral with just 3 visits generating far more revenue per visitor.
    This is a great way to see how different traffic sources contribute to your bottom line such as:

    • Organic search
    • Email campaigns
    • Referral traffic from blogs or social

    Like the example above, segmenting your revenue gives you a look into how customer spend changes depending on the traffic source.

    For example, you might get far more conversions from Facebook referrals, but those people only buy a single product. Compare that to traffic from email campaigns where the conversions are a bit lower but the average order value is twice the size.

    Use that data to replicate what you’re doing right with certain channels and where to invest more time and resources.

    GrowthScout has a step-by-step guide to setup your Google Analytics for tracking revenue by traffic.

    Conversion by Product

    If you only have a handful of products in your online store this is likely less important. For e-commerce stores with a huge SKU inventory though, this is a necessary metric to pay attention to.

    Google Analytics Enhanced E-commerce has this data readily available in the “product performance” section.

    Image Source

    It’s a great metric for tracking the performance of individual products when you compare individual product conversions against product page traffic and those who added the product to a cart or wish list but abandoned the purchase.

    Not only can this help you spot the popular or trending products, you can also find the under-performers.

    Looking at the conversions by product can make it easy to look into individual barriers that could be impacting conversions (price, descriptions, product images, better benefit statements, etc.) and make strategic adjustments.

    Funnel Abandonment

    Cart abandonment is fairly common metric that’s tracked by online stores. E-commerce platforms are even designed to help you keep up on cart abandonment with built in autoresponders to help win back abandoned carts.

    Pixels are even in place for many brands to setup ad retargeting for customers that bail on the checkout process. But are you looking at the rest of your funnel to see where customers are dropping out during the shopping experience?

    This can be done manually by checking the visitor flow on your site, or you can setup a conversion funnel in Google Analytics to see where potential customers are bailing on you.

    The Funnel Report is one of the most popular features in the Kissmetrics platform. Identifying where customers drop off and segmenting your traffic to find the most valuable marketing channels are game changers for e-commerce stores.

    Here’s a great example of a conversion funnel setup in Google:

    Like the example above, tracking funnel abandonment can show you key points early in the buyer’s journey where customers are exiting your site – whether it’s at category pages, the product page, etc.

    Percentage of Returning Customers

    Returning visitors is a great metric to track for measuring customer loyalty, but it helps to know how those returning visits translate to revenue. That’s why you should track your percentage of returning customers – the people who come specifically to spend money.

    A lot of e-commerce platforms provide customer reports with details on the number of returning customers.

    Image Source

    Shopify provides detailed reports for first time vs. returning customers.

    If you don’t have a way to access a report like this, you can export your total orders and scrub the data for duplicate emails/customer data to get a sense for repeat orders.
    Percentage of returning customers is important to watch. It tells you where you stand with your customers on a number of key things:

    • Customer service
    • Price
    • Trust
    • Customer sentiment

    Returning customers are highly profitable because you don’t have to pay those acquisition costs to get them back. If you see a decline in return customer rates then you need to look at overall customer delight and try to find what’s keeping customers from coming back.

    It’s not just about return revenue though. The best marketers for your business are your happy, fully satisfied customers. Those are the customers who will talk you up and take the time to leave you reviews. Data shared by Kissmetrics shows that 55% of customers say that reading reviews online influences their decision to make a purchase.

    All the more reason to track your return customers so you can identify the ones who aren’t coming back, and ramp up your re-engagement strategy.

    Average Order Value

    Your average order value (AOV) is the sum of the value of all of your orders (the total revenue for a period) divided by the total number of orders for that period.

    For example, if you were tracking the sales for the month of August and found a total revenue of $25,000 with 760 orders. The revenue ($25k) divided by the total orders (760) equals a monthly AOV of $32.89 ($33).

    Knowing your AOV is necessary to understand the lifetime value of your customer and helps you better align strategies for growth.

    According to ConversionXL, there’s only three ways to grow an e-commerce business:

    • Add more customers
    • Get customers to make more repeat purchases
    • Increase the average order value

    Increasing your AOV is the one that costs virtually nothing, so focus on that.

    Optimizely offers some tried and true strategies for boosting AOV, such as:

    • Cross-selling (offer a product that is relevant to the product customers are interested in)
    • Upselling (offer an upgraded option, or premium product, for just a little more)
    • Volume discounts (offer a discount if a customer buys multiples of the same product)
    • Free shipping (offer free shipping when the customer hits a minimum dollar threshold)
    • Coupons (offer discounts/offers on the next purchase if they hit a minimum dollar threshold)

    Lifetime Value of the Customer

    Customer lifetime value (LTV) is arguably one of the most important metrics to track in e-commerce. This is the overall revenue you forecast a customer to bring you during their lifetime, or span of time as your customer.

    In an earlier example calculating average order value I said the AOV was $33. If the average customer purchased 14 times at that AOV then the customer’s LTV would be $462.

    This can be difficult to track for businesses with more sporadic returning customers because you have to know the lifetime of the customer, at what point they leave, the frequency and other variables.

    Depending on your platform you may have built in reports to show you your top customers as well as the lifetime value of those customers (and overall customer LTV).

    Image Source

    BigCommerce offers similar reporting tools to help calculate and forecast and better understand LTV.

    It’s worth forecasting with the data you have because this can help you better understand your cost per acquisition and how much you can afford to spend on both acquisition campaigns and retention/engagement marketing.

    Aside from better calculating what you can spend on acquisition, returning customers just spend more overall.

    Businesses with 40% repeat customers generated nearly 50% more revenue than similar businesses with only 10% repeat customers.

    Improving customer LTV has a lot to do with loyalty and retention, so look closely at what you can do to keep your customers coming back.

    View original article here

    Google Says They Are Not Done Announcing Future Algorithms

    i wish you like this post on Google Says They Are Not Done Announcing Future Algorithms

    For about almost 14 years now, I’ve been reported on Google algorithm updates. We’ve been through different levels of communication with Google regarding these updates.

    Early on, Google simply did 30 day Google Dances, so it was clear when Google did an update. After that we had updates like Florida and many others that Google did not confirm or talk much about, but we knew there were major changes. Then Matt Cutts at Google shared very specific details on updates around Panda, Penguin, EMDs, and many others. In fact, he would give us the percentage of change Google noticed in the search results around them.

    Now we are back to a point where the only changes Google is communicating are major indexing issues, like the mobile first index and such. Google has not confirmed officially any search quality or spam algorithms in a long long time. On one hand, I miss the confirmations, on the other hand, now Google mocks us with their “we change things all the time” line. Of course they do, I write 5 stories a day on this site, so I change this site all the time too! Kristine Schachinger put it well with some of the frustration around the lack of communication.

    So I asked John Mueller of Google about this specifically in a hangout at the 37:34 mark asking “are you guys ever going to confirm algorithm updates in the future? Back in the day, Matt Cutts use to be like yea, this update effected 1.3% of search queries. Matt Cutts retired, you guys stopped doing that.”

    John, and maybe rightly so mocked me saying “yea, we should just keep asking Matt, maybe he knows?” But then added “I suspect we will” communicate more algorithm changes in the future.

    Here are examples of Matt communicating updates such as Penguin releases with links to the Google blog:

    Here he is saying that during one release there was also an EMD update:

    Transparency! Heck, even the Google Twitter account did it:


    Here is the video embed:

    [embedded content]

    He added:

    I think there is some algorithms that definitely make sense to highlight to webmasters. There are a lot of things, at least recently where when I look at what is actually been happening on our side, we are basically just trying to improve the quality and the relevance of the search results and there is not really anything specific that a web site should be doing to change that.

    Espesially when it comes to algorithmic changes where there is something where the webmaster can do to help their site, that is something we definitely want to highlight.

    I suspect that we will have at least some algorithms that we announce. I think because we make so many algorithm changes all the time, it is hard for us to announce all of them. But some of them we will definitely try to announce and I think that also helps webmasters to figure out what they could be doing differently.

    Q: Do you see that happening any time soon? Or you have no idea?

    A: It really depends on what is changing. So the mobile first indexing stuff is definitely something we want to talk about when we get closer. Similar changes where we had something that effected speed, we would love to talk about that because that is something you can actually work on with your web site and if you improve things in that regard, it could help your rankings and that could help your users as well. So that is kind of like everyone wins out of talking about that.

    Q: What about on the spam side or the quality side?

    From the quality side, I think it might depend, I don’t know. The spammy side is probably almost easier. That is probably something where we can say this is an abusive thing where we seen in the past which is kind of problematic and if you’ve been doing it or if your previous SEO has been doing it for your web site then that is something you might want to clean up and here is how to do that. I think that’s kind of a natural match there.

    url to original source

    Danny Sullivan joins Google, leaves advisor role at Third Door Media

    See details of post Danny Sullivan joins Google, leaves advisor role at Third Door Media below

    see more here

    For The Many, Not The Few: Water Resistance In The Mobile Industry

    check out this post on For The Many, Not The Few: Water Resistance In The Mobile Industry

    The media spotlight tends to shine most brightly on a limited number of high-end smartphones in the mobile industry. It’s easy to understand why; they come from manufacturers who have a significant portion of the global market, and are touted as having the latest ‘must have’ innovations and features.

    What we are now beginning to see from the market leaders, are the number of changes to flagship smartphones beginning to gradually decline. The latest iterations are only bringing tweaks in design rather than wholesale changes to the table. This is to be expected as the trend and rate of innovation had to drop off at some point given the time and resources it takes to innovate and create new features.

    In time you would expect these ‘flagship’ features to make their way down to the lower end of the market, especially water resistance which was applauded as one of the most innovative features in the high-end phone launches last year. But it is certainly a feature that shouldn’t be the preserve of the top of the range devices. Technologies that add water resistance to smartphones have been around for more than a decade, however they still aren’t the norm, or even available to smartphone users at multiple price points, with a limited number of exceptions.

    Great expectations

    Consumers though, are now starting to expect a level of water resistance as standard on their mobile phones, partly due to the high-profile launches of devices such as the iPhone 7 or Samsung Galaxy S8. As a result, consumer awareness has increased and started to build momentum so the expectation in mid to lower end of the market is creating a shift in demand. Some level of protection will soon be expected on devices to suit all budgets.

    As liquid ingress is one of the most common causes of damage to devices, there is a clear need for this technology in the industry. A study from IDC states that the total number of devices shipped featuring water resistance increased 76% year on year in the first nine months of 2016, compared to the previous year. Water resistance is increasingly sought as an essential feature rather than a ‘nice to have’ for the modern consumer, providing protection against the spills and thrills of everyday life.

    Breaking down barriers

    There are however, a number of barriers to implementing water resistance technology in mid and lower tier devices:

    1) Time; this type of technology takes time to both develop and then get to market, and on average can increase the testing cycle length of a product by 1-2 months and even more if the original design tests fail

    2) Cost; mechanical solutions to prevent water ingress such as the seals and gaskets you see on a lot of high end devices are expensive due to the engineering, hardware and design compromises required to implement them

    3) Materials; those used to manufacture mid-to-low tier devices do not often suit mechanical solutions such as an ‘O-ring’, which demand high-strength and rigidity. High-end devices usually have strong metal frames whereas lower-tier ones are usually made of more plastic, which are weaker under strain

    Manufacturers and consumers both have a shared goal. They want a quality product regardless of price point, that meets the needs of the consumer.

    Nanocoating technology offers a non-mechanical solution to the problems faced by both manufacturers and consumers. It protects the whole device, regardless of the materials and manufacturing scenarios used; are increasingly fast to apply and can drive economies of scale in terms of being able to coat high volumes of handsets in a short space of time. This makes it a much more accessible technology to the lower end of the market.

    Democratisation as a process

    That of internet access on handsets. A decade ago, the market rapidly changed from having few handsets with this capability (beyond very low functionality WAP), such as high-end devices from the likes of Blackberry, to it being ubiquitously available on pretty much every smartphone.

    In a similar vein, Motorola has been offering water resistance capabilities on the majority of its handsets since 2011, yet few manufacturers have followed suit. There has been a paradigm shift now though, and I expect to see more manufacturers rolling out water resistance across their range and a rapidly increasing market share of handset devices at multiple price points.

    Future-gazing

    check out original

    Why Aren’t We Listening To The Evidence On Practical Science?

    check out this post on Why Aren’t We Listening To The Evidence On Practical Science?

    We’ve all seen the headlines on school science practicals – they’re too boring, or too predictable, or just not happening often enough.

    But when new research comes along, with evidence of what good practical science looks like, it seems we’re not listening.

    Part of the debate about practical science rests on the fact that we don’t even agree on the basics: what makes a good practical lesson? What are practical lessons supposed to achieve? How can schools improve the quality of their practical science?

    In 2015, Ofqual removed practical exams from science GCSEs and A levels. Instead, practical skills and knowledge are tested through written exams. Students are supposed to do some practicals – but if they perform poorly, it doesn’t affect their grade.

    The goal was to give teachers the freedom to do more interesting, open-ended experiments with their students – not just follow recipes at the lab bench. But many people disagreed with these changes, including the Education Secretary at the time, Nicky Morgan, who said it would harm the next generation of scientists, and the Wellcome Trust who said the reformed A levels won’t reflect students’ abilities. The professional bodies complained that many of the existing practical exams for A level had already been interesting, open-ended investigations, exactly the kind of experiments that the changes were supposed to favour – and they had just been scrapped.

    There is a risk that teachers use their new freedom to cut the number of practicals they offer students. Most teachers believe that for A levels, the changes have been positive – but not all do.

    So, what is new?

    The Gatsby Foundation’s new report, Good Practical Science, draws together research from around the world on good quality practical science at school. The report authors visited teachers and education experts in 19 schools in Australia, Finland, Germany, the Netherlands, Singapore and the USA – all countries which perform very highly on the PISA rankings that compare countries’ education systems.

    Sir John Holman, who led the report, and his colleagues identified ten benchmarks for good practical work. The benchmarks are pragmatic and workable. They include things like ‘teachers know the purpose of any practical activity’ and ‘each lab has enough equipment for students to work in small groups’. Yet, a sample of 10% of the UK’s schools found that none of them achieved more than seven out of ten of the benchmarks. A third of UK schools didn’t achieve a single benchmark.

    You might think these benchmarks are just for science teachers – that groups of science teachers and technicians need to get together and work through the benchmarks, one by one. But most of the Good Practical Science report’s recommendations are aimed at people who aren’t teachers, including government, Ofqual, Ofsted, teaching unions, teacher trainers, science professional bodies, funders, and others.

    To achieve the benchmarks, science departments need support from this wider group – and that means those of us who work to support schools need to consider how we contribute to these recommendations.

    Teachers face tough decisions every day: shall I do a practical or a revision class? Shall we arrange a trip to a local science centre or university, or will that disrupt the teaching timetable too much? We can’t just keep adding more and more tasks to teachers’ already hefty workloads.

    At the British Science Association, we are committed to helping schools achieve these benchmarks. Benchmark Eight is ‘investigative projects: students should have opportunities to do open-ended and extended investigative projects’. For over thirty years, the British Science Association and partner organisations have provided the CREST Awards scheme, which supports five to 19-year-olds to do their own open-ended, investigative projects in science, technology, engineering or maths. We recently launched a new digital platform that enables all teachers, right across the UK, to sign up for a free CREST account. This year sees our biggest-ever programme of grants for schools, to enable them to do engaging, investigative science activities with their students and local communities.

    check out original

    Why Unscalable Marketing Activities are Best for B2B Companies

    this is a note on Why Unscalable Marketing Activities are Best for B2B Companies.

    Be sure to view the entire essay and view the original source

    Most blog posts talk about going viral.

    They talk about network effects and refer-a-friend tactics.

    They talk about switching your orange button to a green one.

    They talk about sending out automated, cold emails.

    Well, guess what?

    None of that works in B2B. Not at a high level. Not when you’re selling to smart, educated people. Not when there are tens of thousands (or hundreds of thousands) at stake.

    All of those easy, ‘scalable’ tactics that blogs love to rave about fall flat.

    The best way to close high-dollar B2B accounts is to do the opposite. You need one-to-one communication ASAP.

    The problem is that the best methods are largely unscalable. At least on the surface. So they appear to require tons of your time and energy. Of which, you’re already running dangerously short.

    Here’s why seemingly ‘unscalable’ activities work best. And what you can do to lessen the pain.

    Why 1-to-1, unscalable B2B activities convert best

    Sales is positioning.

    B2B sales, especially.

    It all comes back to the bottom line.

    Are you an expert or a hack? A partner or a vendor?

    Your ability (and almost as important, the perception of your ability) is on the line. It’s what separates cost-plus vs. value pricing. Thin margins from fat ones.

    Experts and consultants? They don’t email customers garbage. Customers go to them.

    That’s why your approach matters. A lot.

    All those fancy growth hacks? They might work on the mass market paying $0.00 for your shiny photo sharing app.

    But not as much when tens of thousands (or hundreds of thousands) are on the line. Not when MBA-toting, C-suite execs with decades of experience can sniff out your bullshit from a mile away.

    B2B doesn’t buy on impulse. A rush of blood to the head won’t cut it.

    Instead, they’re conducting at least a dozen searches before ever visiting a brand’s website. Most of the purchasing process actually takes place before they consider you personally.

    They’re informed. And there are usually many of them required before signing on the dotted line.
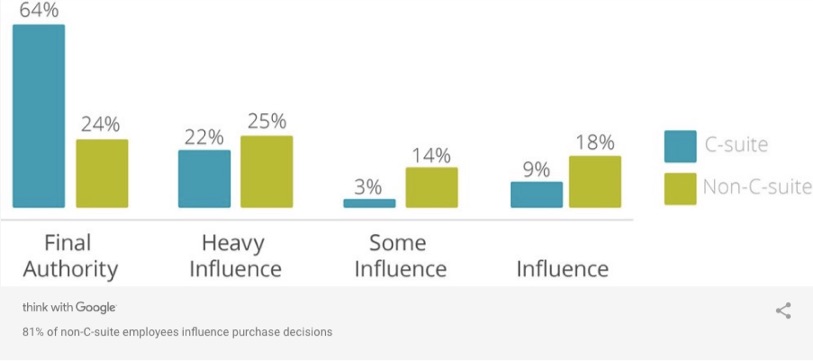
    Image Source

    All of this means the average sale is going to take longer. It’s going to be complex. It’s going to require many conversations over many weeks with many different people.

    You can scale some of it. You can automate parts of it. But when it matters most, when the chips fall, unscalable activities win.

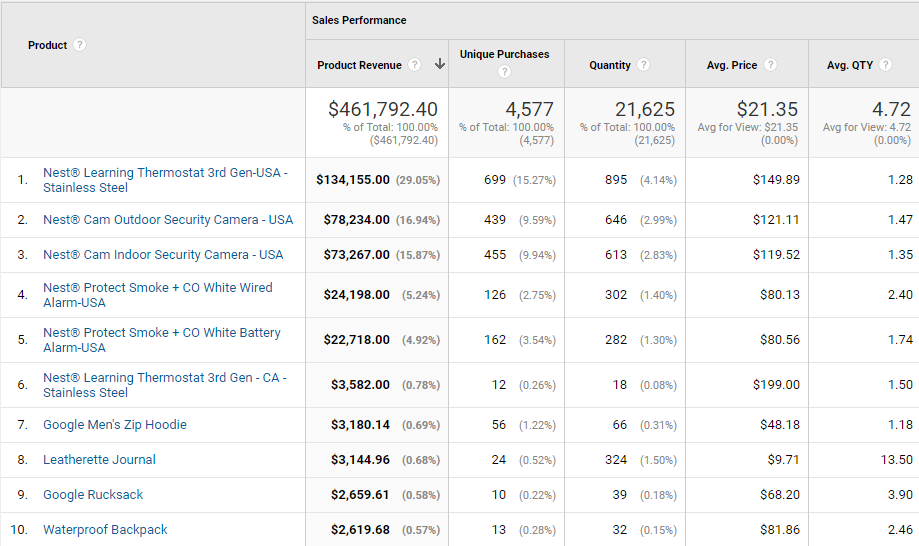
    Take a look at these example conversion benchmarks for the software industry from Capterra:
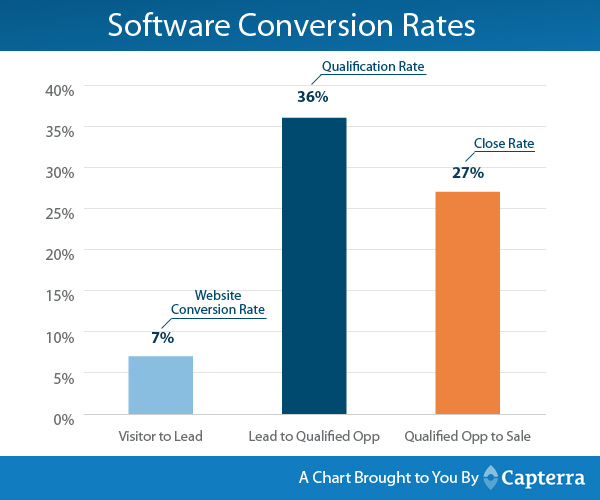
    conversion rates for software companies capterra

    Image Source

    Average website conversions hover around 7%. If you’re lucky.

    After that, the qualified conversion rates jump to 36% and 27%. Why?

    Why is the top of the funnel conversion rate so low, while the bottom of the funnel one is so high?

    One answer is that people become more qualified as you go. And the other is that you’re handling the qualification or sales personally.

    Lead scoring might help. A tiny bit. But otherwise, you’re sending emails, making phone calls… selling.

    All of which is manual, time-intensive, and unscalable.

    That’s the theory, anyway. Now, let’s evaluate it in practice.

    What’s the average click-through rate for online ads?

    Around 0.5% for display ads and about 3% for search ads according to WordStream.

    Image Source

    Those numbers are… not good.

    Doesn’t matter how you frame it. We accept it and continue to spend money on it because it’s scalable. It allows us to go and do other things. We put up with mediocre response rates in the hopes that it’s all justified in the end.

    Now let’s compare it to alternatives, so you have some context.

    Funnelholic used to see the same average 2-3% results, too. Until they made a few changes.

    And then? Open rates shot up to 60%. Reply rates leaped to 31%. And they netted 15 new meetings.

    What was the difference?

    They took unscalable steps first. They thoroughly researched each prospect and personalized each outreach attempt.

    Different channel or medium. Same story.

    One company used direct mail to get a foot in the door with $30 million+ companies, receiving a 25% response rate. Another study shows that first-time buyers are 60% more likely to visit a website URL after seeing it on a piece of direct mail.
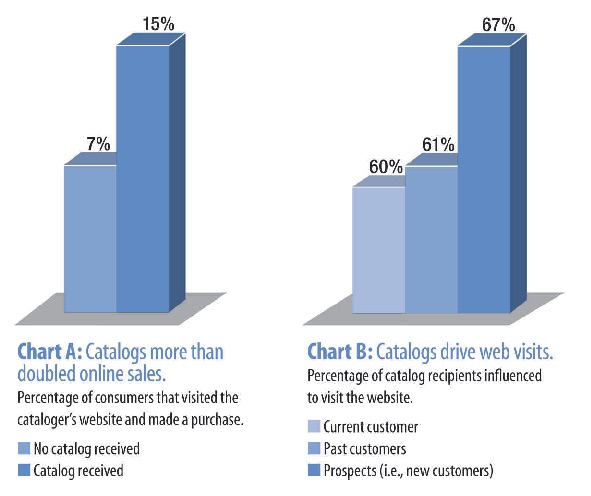
    Image Source

    Let’s do another one.

    Spoke with another founder recently. He literally walked into 13 multimillion-dollar companies cold one day. Now, has two proposals out. That’s ~15% response rate.

    Again: Compare that with ~0.5% and ~3% for online ads. And that’s for just a measly click! The vast majority of which won’t go on to become a lead, qualified opportunity, or sales prospect.

    So really, you’re looking at fractions of a percent.

    The problem with these high-performing tactics?

    None of them are scalable. At least, not on the surface.

    Researching individual people within accounts isn’t. Hand-writing letters isn’t. Creating and sending personalized packages isn’t. And walking into offices definitely isn’t.

    The trick is to make the unscalable scalable. Doesn’t make sense, I know. But it hopefully will in a few minutes.

    You should be able to find a way to scale multiple “unscalable” activities with people, processes, and tools. Here’s how.

    Start at ground zero with your target accounts

    The lazy answer to this quandary is “account-based marketing.” Which is really just a euphemism for “not terrible marketing.”

    Image Source

    Instead of only qualifying and disqualifying toward the end, you do it upfront. You invest more time and energy whittling out the junk so that you can focus more attention and resources on fewer, better potential customers.

    Don’t take my word for it.

    This is the essence of Predictable Revenue. The same one that added $100 million to the top line of Salesforce. The same one that the fastest-growing SaaS sales teams use today.

    It’s a mix of inbound + outbound. You use the best of both to expedite the process.

    Inbound is great. But it takes for.ev.er. And results don’t always pan out like they should. Not like you were told. Not in the beginning. Not in competitive industries filled with low-volume, long-tail queries.

    Example: “Content marketing.”

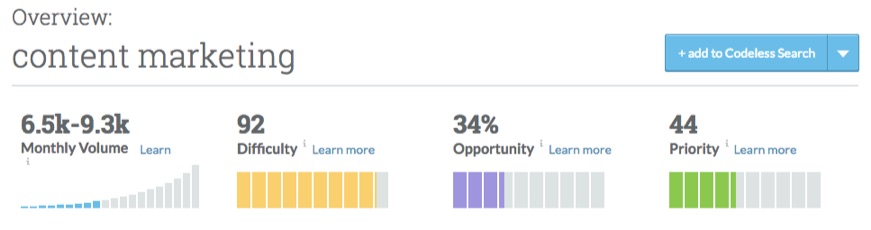
    Ninety-freaking-two difficulty score. While the volume range puts it around mid-tail, best case scenario.

    Now, try ranking on that term with a 500-word blog post. Try ranking for that term with “Best Content Marketing Tools” or some other inane post.

    That might work in the local pool biz. Ain’t gonna cut it here.

    That’s why it takes more. It requires more. The only way you’re going to sell five or six-figure deals is to pitch the hell out of a dedicated account.

    The trick is to do the hard work upfront. Define your ideal Customer profile, and everything else becomes easy.

    But we can’t do that for you. Unfortunately, you’re on your own.

    LinkedIn does, however, give you a few ways to pre-qualify prospects at scale.

    The first step is their LinkedIn Sales Navigator. You can select firmographic criteria like job titles, company size, geography, and more to have them compile a prospecting list for you.

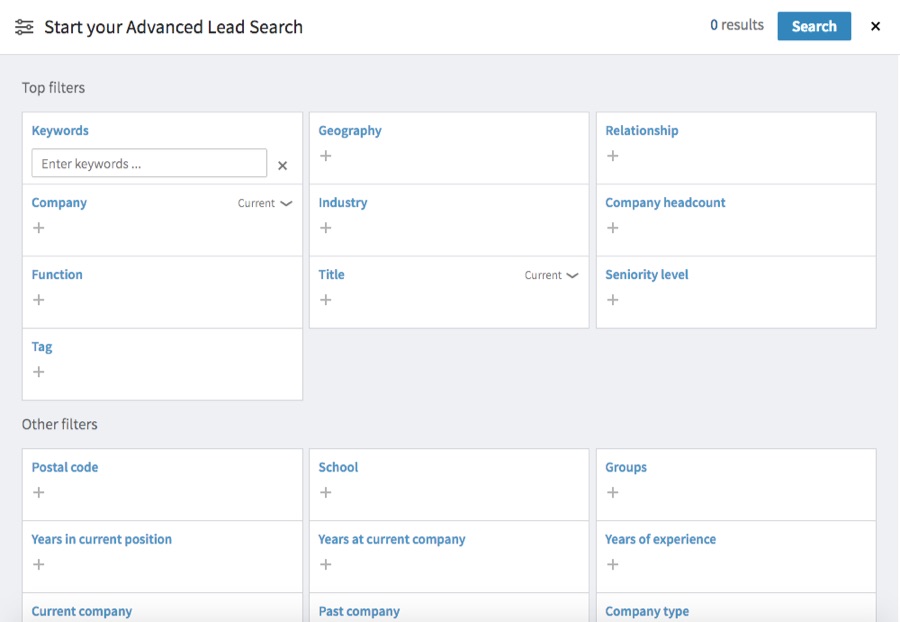
    Then, you can save companies as new accounts to get access to all of the individuals inside.

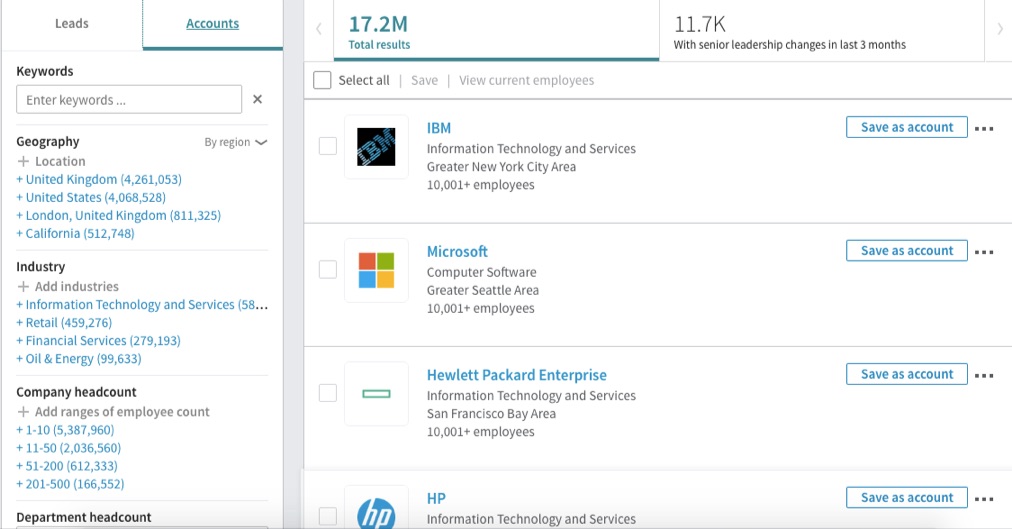
    Next, cue: stalking.

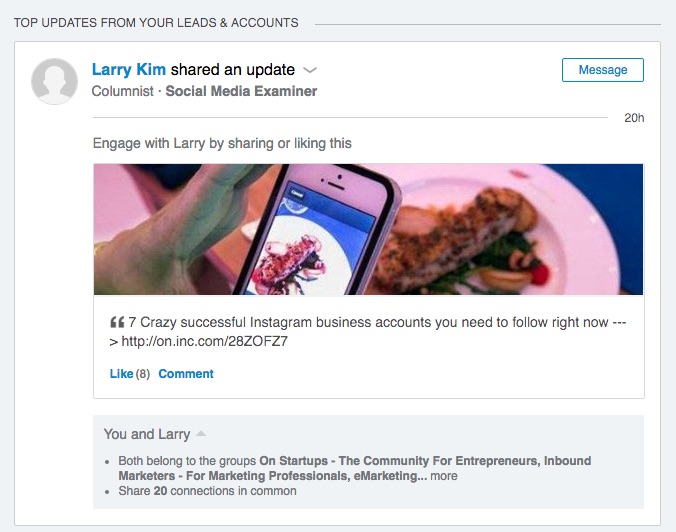
    LinkedIn’s Sales Navigator will provide a never-ending stream of updates when filled with accounts. Every time your key people do something on the site, you’ll see it.

    And you’ll be social selling in no time. The same strategy IBM has used to increase sales 400%.

    This is the hard part, though. You need to get on their radar. Not by sending spammy InMail messages. But by reaching out and discussing. You build that whole relationship-thing.

    You can also combine some inbound with your outbound here.

    For example, you can run content promotion to these target accounts to passively build brand awareness.

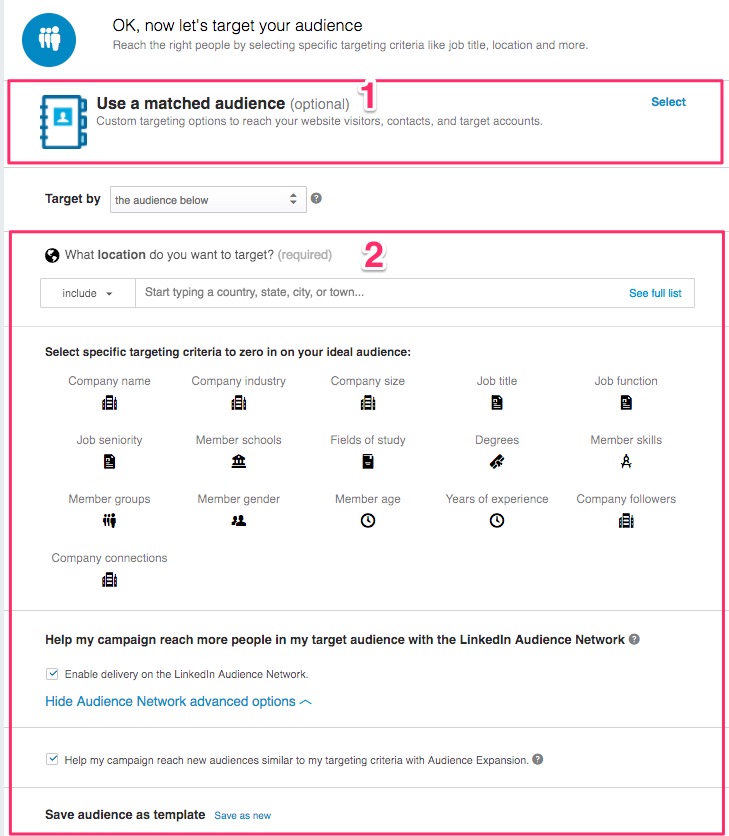
    Then, you can use LinkedIn’s new Matched Audiences feature. This is more or less their version of Facebook’s custom audiences.

    You can target contacts that have been to your site before. Or you can upload a list of contacts that have opted in somewhere along the way.

    This is where you add scale. You shouldn’t necessarily automate meetings with prospects. You really can’t, in fact.

    But you can start to automate some peripheral activities, like these retargeting ads that run in the background.

    And you can also start to streamline “unscalable,” individual prospecting techniques. Here’s how.

    Now, make the unscalable, scalable

    There’s one thing standing between you and more paying customers.

    It’s not time. It’s not money. It’s not a tool.

    And it’s not even a hack. It’s a process.

    That’s it. Sexy, right?

    A little over a year ago, my company sent these out in the mail (among other things).

    direct mail advertisement missing piece

    Not the best. But not bad.

    We sent each one with a handwritten note. Then we stuffed both inside an envelope and mailed it to an individual within an account company’s headquarters.

    Now, you’re probably thinking that this sounds time-consuming. And that’s because it was. Very.

    Initially, we did all the work. Even bought the envelopes at a Staples (remember those?) and brought them to an honest-to-goodness post office.

    The initial results were promising. Solid responses started to roll in.

    So here’s where things get fun. You create a process around this to hand off to someone else.

    Fortunately, there’s this magical secret to dealing with menial, recurring tasks like this. They’re like little magical elves who just come sweep up after you so that issues go away.

    They’re called: interns.

    The trick is that you have to tell them exactly what you’re looking for. Most don’t. They just expect them to know. And results suck. “Interns are lazy” etc. etc.

    Each step is its own little process. There should be details on how to stalk find key accounts on LinkedIn, how to build a prospecting list, and so on.

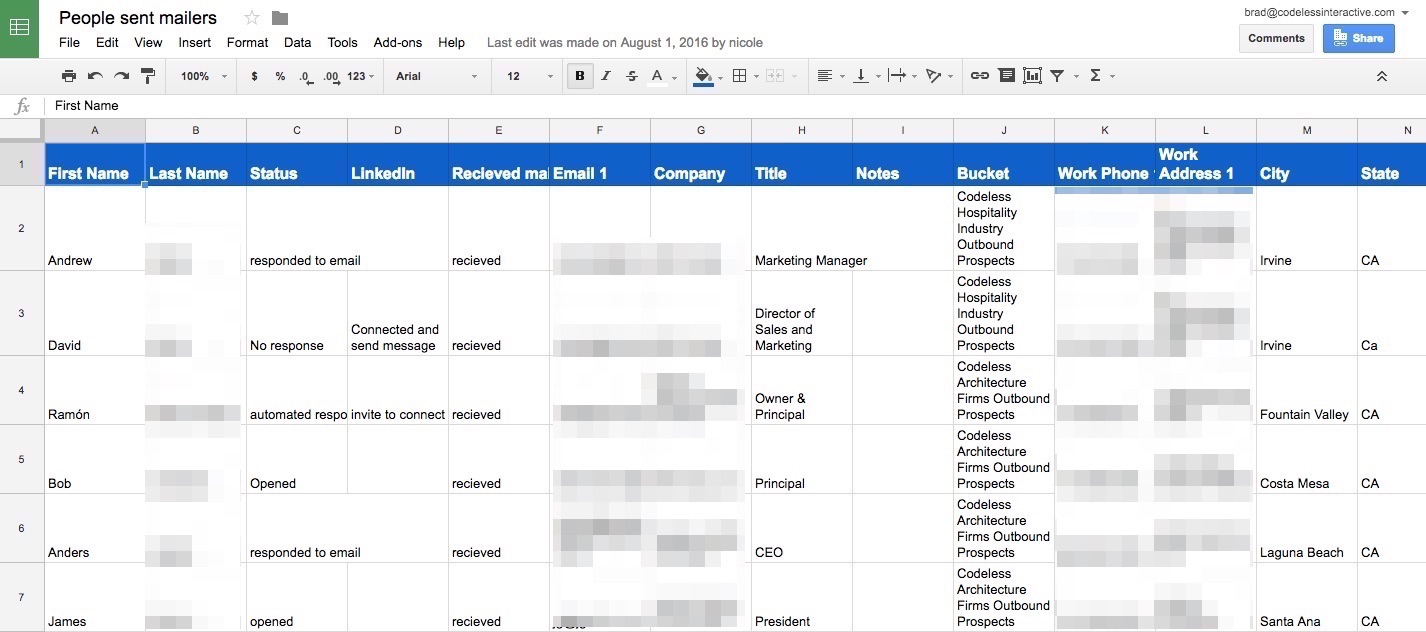
    Pretty soon, you’ll have hundreds of names. For pennies on the dollar.

    Re-visit those stats above. A 10%+ response rate with hundreds of names, with each potential client worth well over $10,000 over the next year?

    I’ll take that over ‘going viral’ any day.

    Change your perception on what can or can’t be scaled

    People like their habits. They like their business-as-usual.

    Take forms. Do we need them?

    Maybe. Maybe not.

    Here’s how it typically works. A person visits your site and opts in. Awesome! Except, they’re not super clear on what comes next.

    Internally, that notification goes… somewhere? You get around to vetting the lead, eventually. And then reach out hours, days, or weeks later.

    By then, the prospect has already moved on. It’s too late.
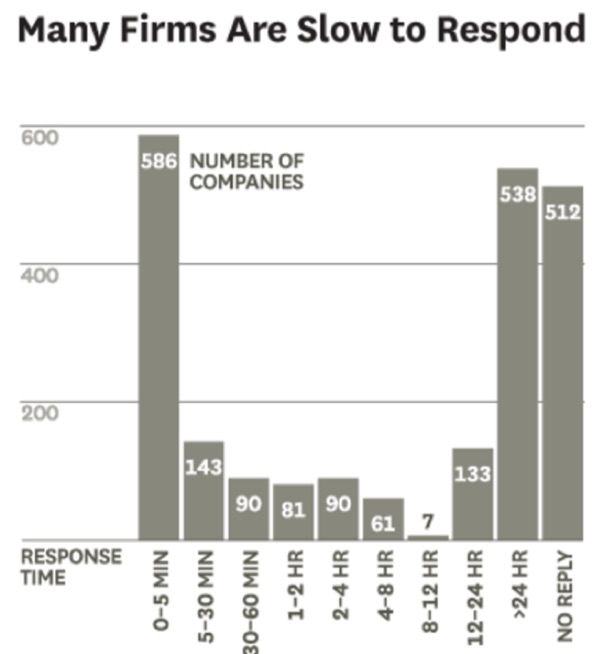
    Image Source

    Your chances of qualifying each new prospect fall by 400% past the five-minute mark.

    So how can you scale the unscalable?

    Live chat is one solution. It satisfies 92% of peeps. Companies like Influx have used it to bring in 27% of inbound leads and grow companies by 20% each month.

    But not the way you’re thinking. You can’t afford to hire someone to sit there all day.

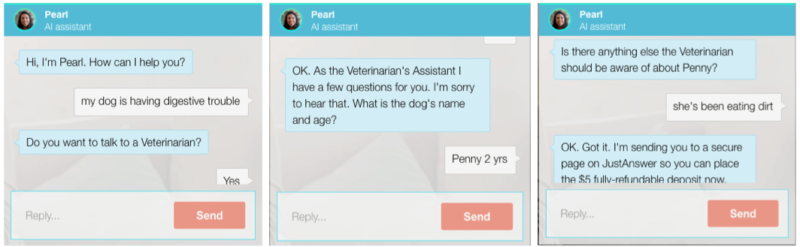
    Thankfully, you can now use chatbots to do everything from qualifying new prospects to scheduling sales calls with hot prospects. And then helping you close more deals.

    You can pre-program the sequence. And your chatbot will do all of the heavy-lifting for you.

    TrainedUp, a video training service for church leaders, recently implemented this approach.

    Think about your average form-based conversions for a minute. You’re lucky if 7-9% of visitors are opting in for your services.

    TrainedUp is seeing 25% of visitors interacting with their chatbot. Then 15% of those go through with scheduling a demo. And 40% of those chatbot-driven demos are converting to paying customers.
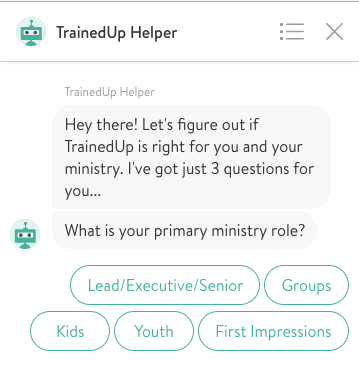
    Image Source

    A lot of TrainedUp’s success is coming from using Drift’s Playbooks. This feature poses three simple questions to completely onboard new leads for you.

    Directive Consulting does something similar. For example, the chatbot can qualify (or disqualify) prospects for you without a single person manning the station.

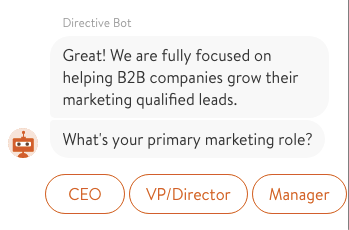
    For example, you only want to work with decision makers. So ideally, you’re looking for “CEOs” and “VP/Directors” who can sign on the dotted line. Then, you can customize a different response for “Managers” to make sure nobody’s wasting each other’s time.

    Let’s select “VP/Director” to keep the conversation going.

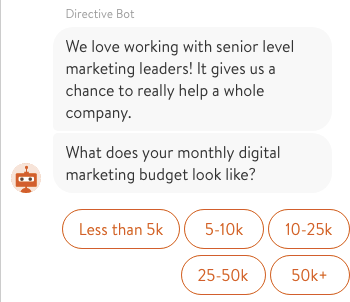
    Next up, you can get some basic budget information. Once again, this helps better qualify and segment new leads. If someone’s budget is “Less than 5k,” for example, the chatbot politely informs them about project minimums.

    It can even help you route leads to different reps or divisions. The services you deliver to a client in the $5-10k range might be vastly different from those in the $50k+. So this allows you to figure out who each visitor should be speaking with internally.

    Because the next step is to solve the main problem we had earlier: planning the next step.

    You now have all of this valuable data. You know if they’re a good fit or not. You know exactly which department, division, or rep to refer them to.

    So why make them wait for a “follow-up” that’s not likely to happen anytime soon?

    Instead, you can then immediately have them schedule a new sales call.

    Drift has a built-in calendar feature that integrates with most calendars. So, the chatbot can even schedule conversations in real-time.

    Otherwise, you can respond with a Calendly link (even customizing different links and availabilities for different types of leads).

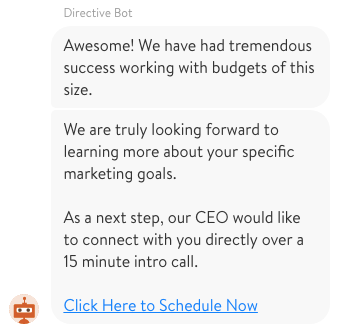
    So if someone successfully makes it through the first three questions, they receive a link to schedule a conversation immediately:

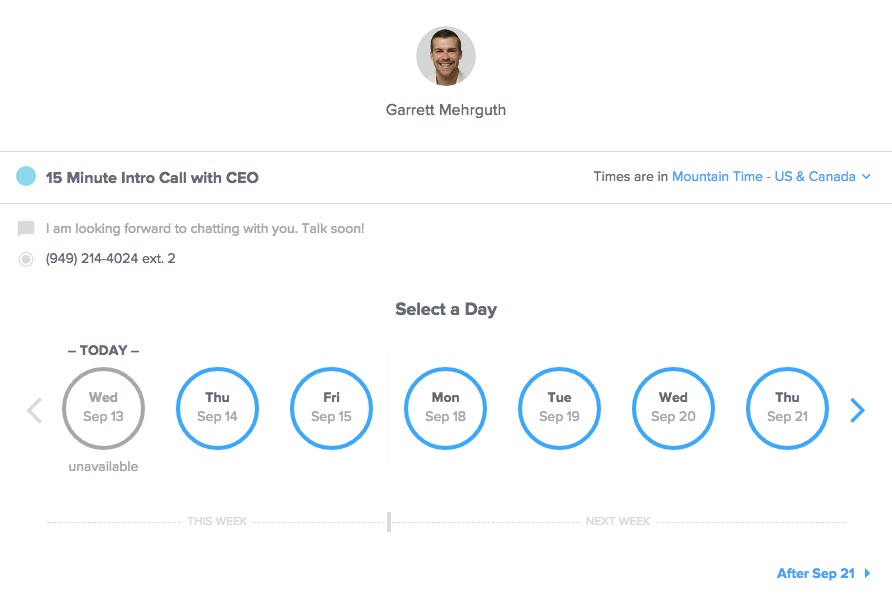
    Replacing a traditional “Thank You” page with a Calendly link so that visitors could schedule appointments on their own helped Virtru increase conversions from around 30% to over 61% in a single month.
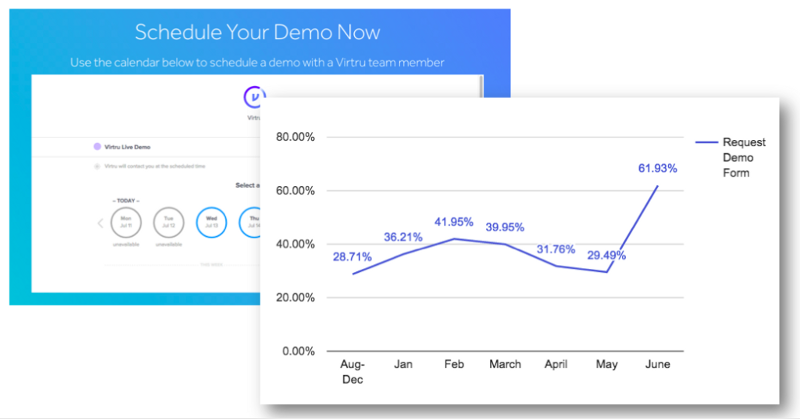
    virtru schedule demo ab test

    Image Source

    Conclusion

    ‘Viral’ marketing might work for B2C. Network effects might help you get more users into a free photo sharing app.

    But none of that realistically works for B2B.

    The problem is that you often shoot yourself in the foot when you focus exclusively on scalable marketing activities. Those things only work at the bottom of the food chain.

    View original article here

    All-new MarTech Today guide: Enterprise Digital Personalization Tools

    See details of post All-new MarTech Today guide: Enterprise Digital Personalization Tools below

    see more here

    5 ways to capitalize on Google Tag Manager

    See details of post 5 ways to capitalize on Google Tag Manager below

    Google Tag Manager (GTM) has revolutionized the way we implement scripts and tags on websites. However, many marketers aren’t fully utilizing this tool or capitalizing on its potential benefits.

    Here are five easy and impactful ways to use GTM. These tips will help you improve your analytics dashboards, your SEO results and your marketing automation programs.

    1. Improve the accuracy of website traffic data

    Marketers often need to identify and isolate various types of traffic in Google Analytics dashboards and reports. For example, many companies want to eliminate spam or internal (employee) traffic and visits from partners. Typically, they do this by using excluding filters in Google Analytics.

    Google Analytics limits the number of filters to 100. If you have a large number of internal IPs you wish to exclude, I recommend that you use GTM to implement blocking triggers. Blocking triggers are built with a custom variable and a custom event trigger.

    Keep in mind that if you use a blocking trigger, these traffic types will be excluded from any or all Google Analytics views — including the unfiltered view.

    2. Implement structured data

    Structured data is a key way to improve organic search results, but it can be difficult for marketers to implement — especially if you need to rely on technical resources. Google Tag Manager makes it easy for non-developers to implement structured data on any page of a website.

    For more information on how to do this, see “How to add schema markup to your website using Google Tag Manager.”

    3. Ensure accurate indexing

    With Google Tag Manager, we can define URL variables to strip out any additional parameters that might have been added. Then, we can build a custom HTML tag with JavaScript code to insert self-referencing canonical tags in the <head> section of the page. This ensures that no variation of a URL except the default one is indexed by Google.

    You can follow the same logic to insert mobile switchboard tags — if your website uses a mobile subdomain.

    4. Import marketing automation parameters

    Most companies use marketing automation software to capture lead data and track leads through the sales funnel. With Google Tag Manager, you can easily implement lead-tracking parameters and marry this data with Google Analytics information.

    With the built-in variable of first-party cookie, Google Tag Manager can pass lead ID number, along with other parameters, into Google Analytics.

    5. Understand website behavior

    With Tag Manager, it’s easy to track user behavior, actions and conversions with auto events. For example, you can track clicks on certain areas of a page, interactions with a video, or users’ scrolling behavior.

    check out here

    Google May Message Webmasters With Mobile First Indexing Issues

    i hope you like this post on Google May Message Webmasters With Mobile First Indexing Issues

    So we know Google is testing that mobile first index and that the rollout will be done in batches and now John Mueller has explained how they think they might roll this mobile first index out.

    First, it is likely that based on those classifiers, which we mentioned here, that Google will roll out the first batch to pages that are equivalent between desktop and mobile. Then, Google will likely begin some level of communication, be it via blog posts, direct communication and/or Google Search Console notifications for those who have issues.

    Google may classify a percentage of the web pages on the internet as having issue X, when it comes to this roll out and notify them all via Search Console with steps they can take to resolve the issue. Then the same with issue Y and Z. As Google is able to classify more and more issues, they can aid more and more webmasters on how to fix these issues so the rollout has quality neutral release.

    Here is the video embed where John talks about the plans for the rollout:

    [embedded content]


    Transcript:

    It is one of those things that we need to make sure that the changes we make actually work out well. We are creating some classifiers internally to make sure that the mobile pages are actually equivalent to the desktop pages and that sites don’t see any negative effects from that switch. And those are things we need to test with real content, we can’t just make up pages and say this is well kind of like a normal web page. We really have to see what happens when you run it with real content.

    At some point there may be aspects [of the mobile first index rollout] that are more visible but like with a lot of search experiments, these are things that most people don’t notice because in an ideal world, things should just work the same.

    So that is kind of what we are looking at there, looking to do it as a step by step way. Rather then just switch it on and everything breaks. To kind of do this gradually.

    The idea behind this classifier is to kind of recognize common problems that we can do some blog posts around those common problems, so people are aware of what they should watch out for, what they should be fixing, what kind of issues they should be looking at.

    link to main source