How to Master Analytics like Will Smith and Amazon

Here is an note on How to Master Analytics like Will Smith and Amazon.

Be sure to view the full note and view the original site

Will Smith is not just a pretty face. Nor is he just a likeable, talented actor.

He’s a businessman and a master marketer. The only Hollywood star that predictably gets over $20 million per flick. Even his movies that didn’t get good reviews, like Hancock and Suicide Squad, grossed over half a billion each worldwide. Wouldn’t you just love the worst of your ventures to make half a bill?

So, what’s the secret to Smith’s success? How has he chosen just the right way to focus his time, attention and resources?

Is it down to luck? An innate knack for making good decisions? Or an unwieldy drive to succeed?

These factors have played their roles, I’m sure. But Will applied a much smarter, more calculated method to propel himself to stardom. One that your company can – and should harness the power of, in order to drastically increase your customer acquisition and retention.

The answer is: analytics.

It’s the skill of observing what your prospects and customers do and have done in the past, using this to predict what they will do, want and need in the future. Then make smart marketing decisions based on this info, to maximize your profits and dominate your market (just like Will Smith).

In short;

Glance back over your shoulder before you plan new things.

This article will reveal how Smith did it, how Amazon is doing it, and how your company should do it.

The Fresh Prince of Analytics

When Will Smith first ventured into the world of Hollywood movies (from within the clutches of Uncle Phil’s tyrannous reign) he and his manager sat down and analyzed the ten highest grossing movies of all time, looking for patterns.

They analyzed what moviegoers (his target customers) did in the past to determine what they would do in the future. So that they could put Will Smith right where the money would be.

At the time, they found that ten out of ten of the top movies had special effects, nine out of ten had aliens and eight out of ten had a love story involved.

Next stop – Independence Day and Men in Black.

In no time at all, Will Smith became a household name.

That’s a simple example of the power of this technique. In marketing today – especially digital marketing – it’s all-important. It really is the key to consistently better decisions.

Let’s look at exactly how effectively using your data to predict your customer actions can boost your revenue and profits.

Three Ways Analytics Impacts Your Bottom Line

1. It Increases Your Leads & Prospects

Analytics allows you to see, repeat and expand on what works best to boost:

a. Your Leads
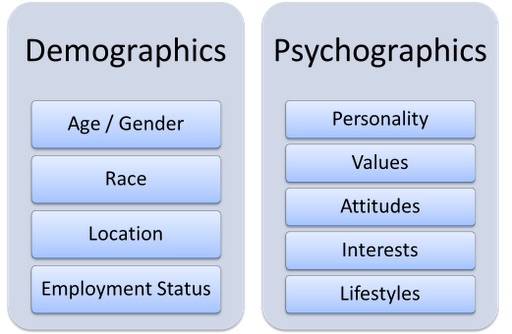
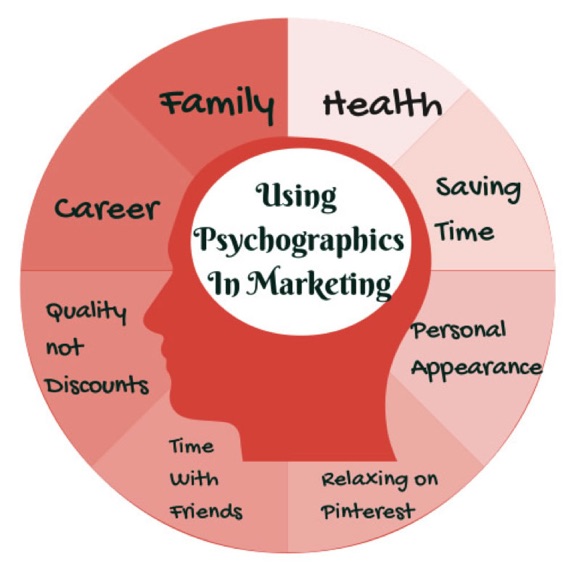
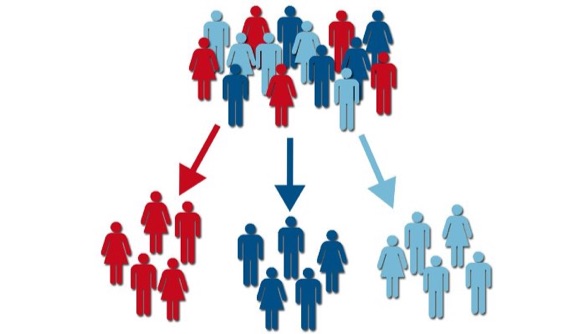
You can find and qualify leads better to know which ones are most likely to become paying customers. We get this by observing patterns in firmographic data (data from the company your lead works for), demographic data, geographic data, psychographic data and through the analysis of the industry and economy.

In other words; who they work for, who they are, what’s going on behind the lights, where they live, and what’s up in their world. All five areas, will give you clarity on where to find the most and best leads.

b. Your Prospects
Once a lead starts showing active interest they become a prospect. It’s getting hotter. They’ve seen the trail of breadcrumbs and are on their way toward you.
Analytics can tell you how to maximize your prospects from the five data types plus extra information your sales team learns while interacting with your customers.
A 10% increase in leads or prospects is a 10% increase to your bottom line (if your conversion rate remains the same).

2. It Increases Your Conversions

Mastering analytics can help you polish the method, frequency, and quality of interactions with your prospects. Refining each piece, cranking those conversions up and up.

It takes qualifying prospects to a whole new level of detail. By turning all important factors into data (such as the prospect’s level of need for the service, their budget, their level of authority, and much more), your sales people can quickly focus where the focus is needed most.

As the skill and precision of your qualifying, sales and closing techniques increase, so does your revenue.

A 10% increase in sales conversions is a 10% increase to your bottom line.

3. It Increases Your Average Customer Value (Purchase Size & Lifetime Value)

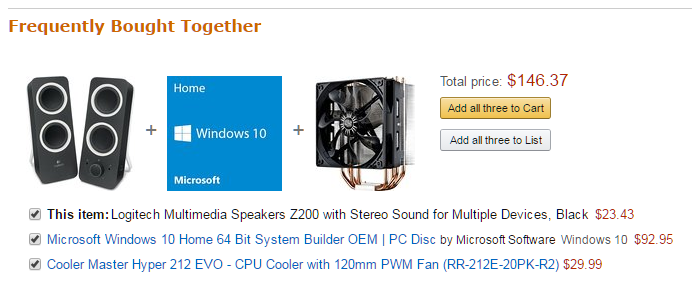
Amazon is the grand master of upselling and cross-selling.

Their ‘frequently bought together’ feature and recommendation system have arguably been one of the key ingredients in their world-dominating success story. Amazon uses data to automatically customize the browsing experience for its customers based on their past purchases, and optimize sales. So in a nutshell, Amazon’s analytics tells them what customers frequently buy together and they simply (and automatically) pass this info onto their customers, to help them out – which their customers absolutely love.

That’s right, good cross-selling is a service, not an imposition! So don’t be shy about it.

And that goes the same for upselling. Almost all customers are interested in at least knowing the options to upgrade.

Think how often you encounter this, from fast food restaurants offering super-sizing to high class airlines offering seat upgrades. If you don’t want the upgrades, that’s fine, but at least you’ll know what’s available and the cost to upgrade.

These successful upsells should give you some food for thought:
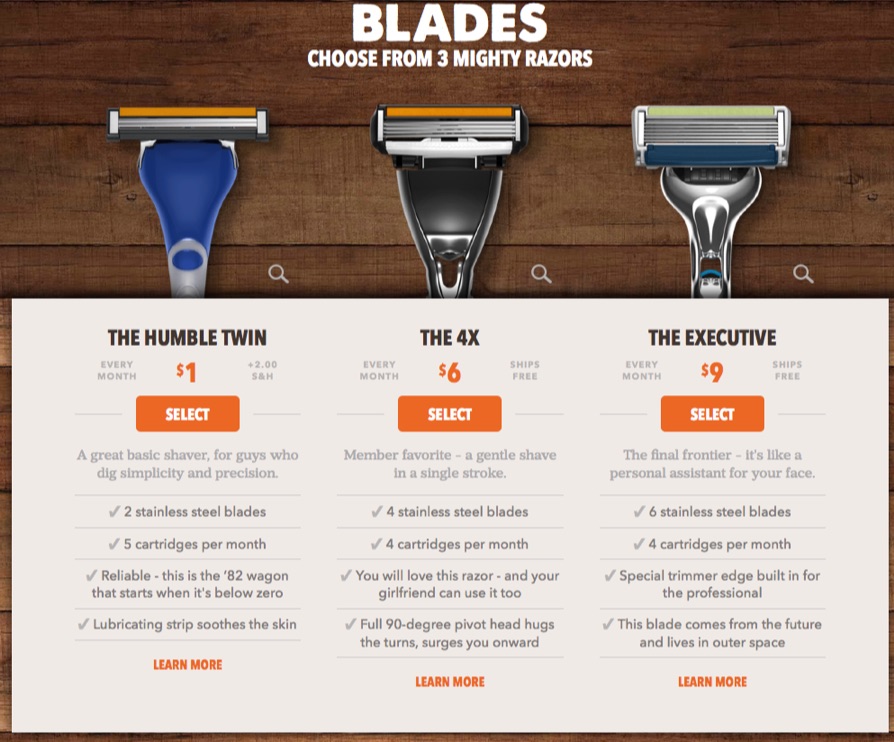
Dollar Shave Club

Dollar Shave Club lures its customers in with an incredibly clever name. But of course, they’d prefer you spend a little more than a dollar. And they encourage you to do exactly that, by lining up their “humble” one-dollar razor against some more appealing, more expensive options. Notice how they’ve dropped in some social proof to make this middle option even more enticing (using the words “member favorite”)?
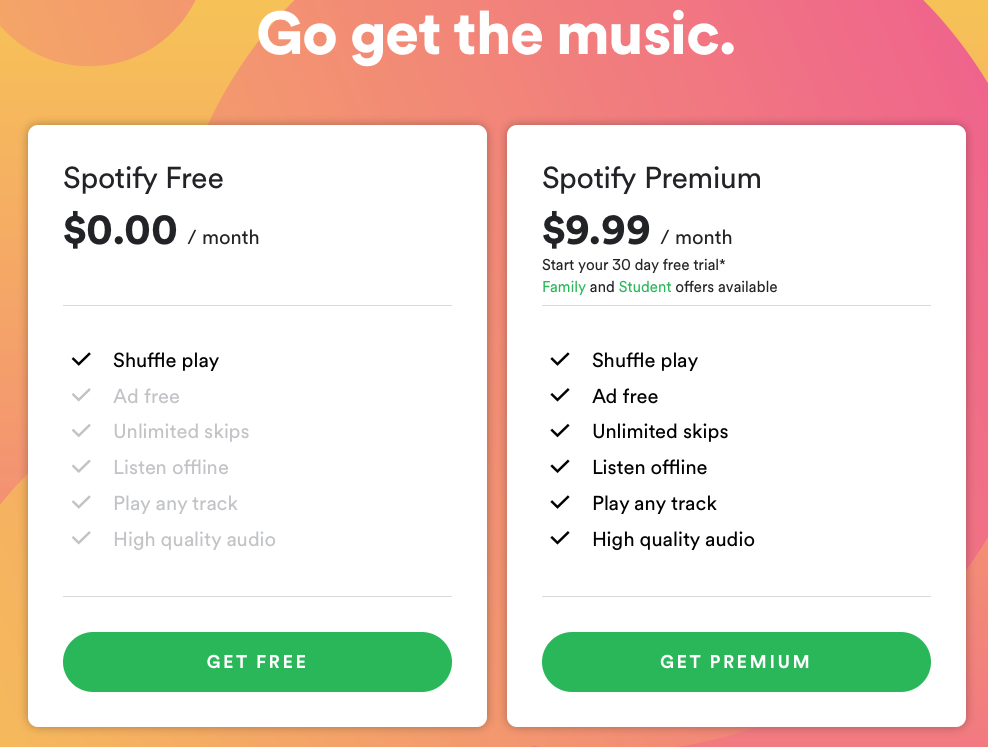
Spotify

Spotify uses a similar, common (and effective) technique. The ‘free’ option here seems pretty bleak next to that juicy ‘recommended’ Premium option, with its colorful design and that long list of ticks. Don’t you agree?

Like Amazon, if you use analytics well, you will know from past customers exactly what extra offers to show your customer, in a way the customer appreciates. These are people already buying from you, which means they like your company already. Of course some of them will be happy to buy a little more. And a little more. And a little more.

Again, a 10% increase in average purchase size is a 10% increase to your bottom line.

Plug that Leak

Two other ways to boost the average value of your customer are to increase how frequently they buy from you and also reduce the number of customers leaving you.

By analyzing your metrics – such as the conversion rates of your cross-sell email campaigns or social media ads – you can understand what methods of communication and marketing are enticing your customers to buy from you more often. So you can expand on this.

It’s an easy stat to boost as, again, these customers already trust and use your service. Customers buying from you five times a year on average, instead of four times a year, is a 25% jump in revenue. Yet without analytics, it’s an area of marketing most people neglect. Make sure you don’t!

And if your bucket has a hole, let’s plug it before pouring in more water.

According to the Harvard Business Review, the cost of acquiring a new customer is five to twenty five times that of holding onto an old one. Yet both have an equal impact on your revenue.

Analytics will help you refine your methods for keeping customers longer (for example, by identifying and getting rid of mistakes that are driving them away – showing you the spinach in your teeth) and bringing back those who have already left.

Once more – a 10% increase in average lifetime value is (yep, you guessed it) a 10% increase to your bottom line.

The Wonderful Power of Cumulative Increases

I love this part. If you hit all three of these figures with a 10% increase, you get a 30% boost to revenue, right?

Wrong!

You get a 33.1% increase.

The initial 10% increase makes your revenue 110% of what it was before. The next 10% increase on that makes it 121% of what it was before. And the next 10% increase makes it 133.1% in total.

That is the power of cumulative growth.

And that’s only a little 10% boost from your analytics. A 20% boost to each is a 72.8% total increase in revenue. A 30% boost to each is a 119.7% total increase. A 40% boost to each is…

Starting to look pretty cool, wouldn’t you say?

See how the little things add up and make your bottom line more buxomly?

Turbocharge your Content Strategy

Apart from the numbers at the top end of the funnel, analytics also make it very easy to improve and streamline your content marketing strategy. You can always know what to say and say it so that people love it.

By plugging into social media and analytics tools, you can quickly see patterns in what content gets liked, clicked, downloaded and shared the most. From ebooks to posts to videos to Tweets. The full shebang.

Always know what’s hot or not with a glance at your dashboard!

Because of this, knowing what to talk about just becomes easy. You become the conversational master of your industry. The heart of the party, not the awkward wallflower in the corner.

And of course, with a better understanding of what your target prospects actually want to read/hear/watch, you can create content which attracts, engages and converts more. And yes, that means faster growth, more leads, more conversions, more sales, more profits, more money, bigger houses, etc.

So, How Exactly Can You Start Making the Most of Analytics?

To put it simply, you need to set up systems that collect data for you – data about your prospects, customers, market trends, methods and sales techniques. Data about everything. You need to arrange this in a way that is simple for you to glance at and see helpful patterns emerge.

When you have this system set up, you can make decisions and then watch the impact on your bottom line. If the impact is good, you can go further in that direction. If it’s not, stop.

It’s that simple.

It’s really all about being able to see the 20% of customers, offers and activities that get you 80% of your results. Then focusing on that 20%.

It’s all about efficiency. If Mr. Pareto were still around, he would love analytics.

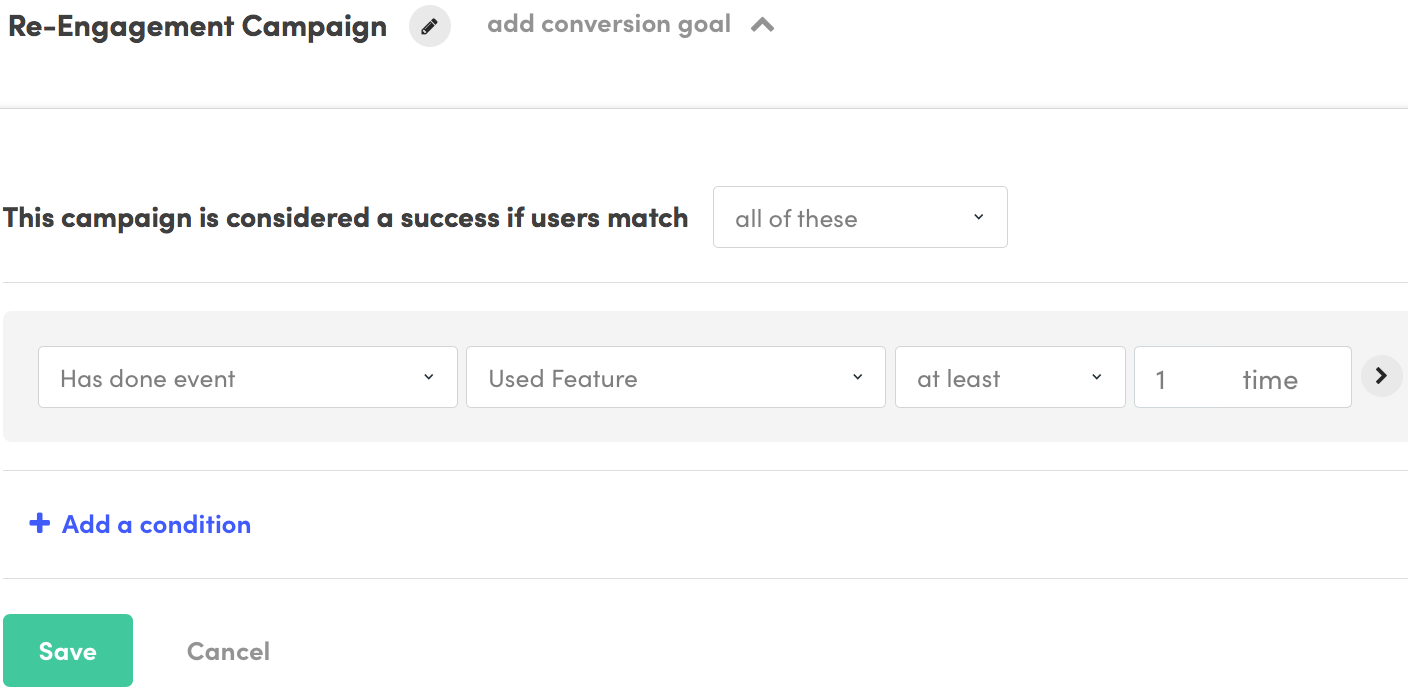
Two Tools that Nail It

There’s a lot of noise about analytics tools out there, so let’s keep it simple. Here are two useful tools you can start with. Check them out, test them out, and see what works for you.
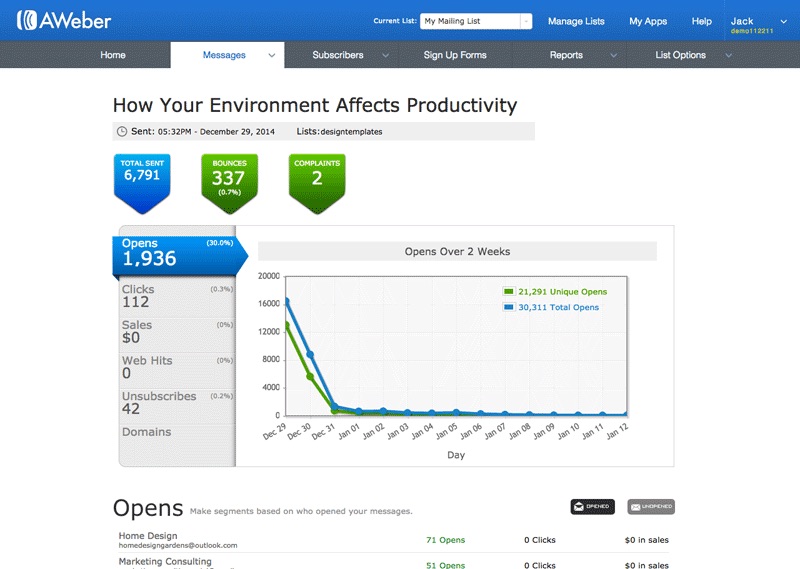
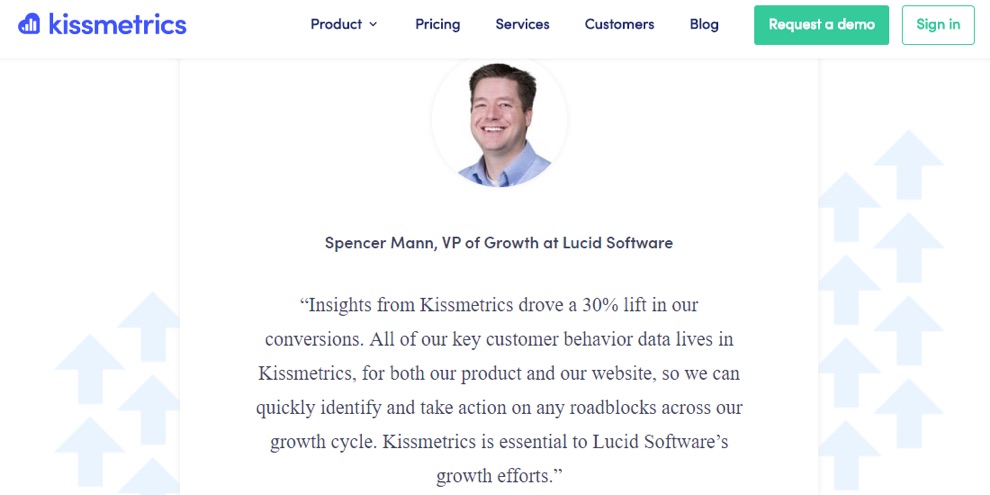
Kissmetrics
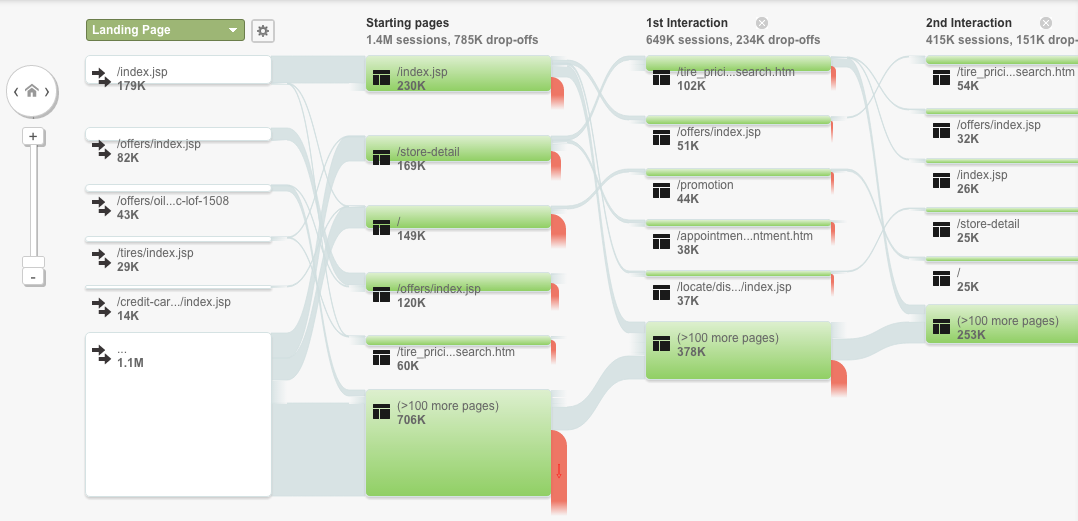
Kissmetrics is a great choice for detailed and easy analytics. It creates profiles for customers across all devices. It tells you about customer behavior, response to product features, etc. It tells you where people drop off in your funnel and how segment behavior changes over time, and more. A tiptop tool to start with.

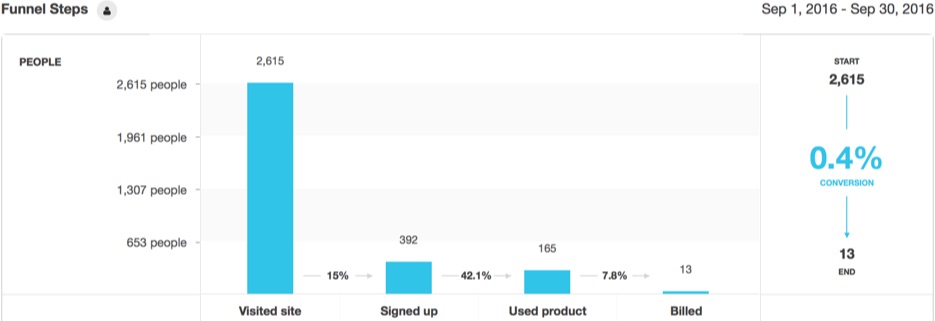
The Kissmetrics Funnel Report

Google Analytics
Google Analytics works well as a simpler introduction to analytics. You can start with Goals, an underused feature of Google Analytics. You tell it even very specific actions on your site to track (time-on-page, opt-ins, video plays, add to carts, anything really), the tool tracks it and displays it in Google’s usual easy-to-follow format. That’s the free option, you can also upgrade to Google Analytics 360 for a more comprehensive online-only tracking platform.

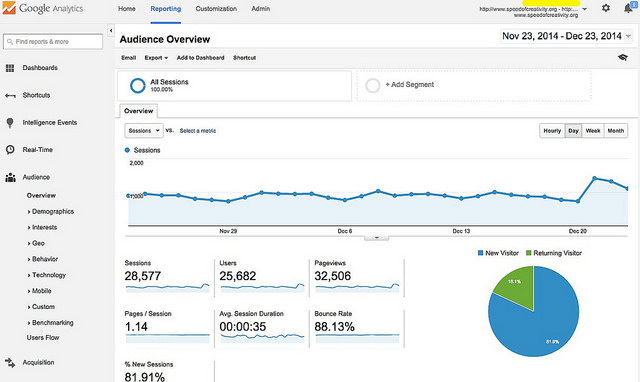
Audience Overview in Google Analytics

This is a Story All About How…

Let your journey of analytics analysis begin. I guarantee it will add a twist to your company story (a good twist, not a Game of Thrones twist).

It really is one of the surest ways to crank up your revenue, your content quality, and understand your customer and business better than your competition. Because when you have a solid system in place you can see patterns with ease that your competitors miss. Day in, day out.

And those three key revenue stats really are worth paying attention to! Making changes and measuring results is easy when you keep track of your leads, prospects and average lifetime values.

It makes you more secure too. You can understand and pinpoint profit problems, quick as an F1 mechanic fixing a Lotus, mid-race.

Don’t let the jargon around this topic put you off. Everyone is just trying to sound clever. Remember, you’re just doing it like Will Smith and Amazon – look to the past, take what works, put it into play, and watch your profits grow.

Good luck!

I hope you enjoyed this article on How to Master Analytics like Will Smith and Amazon

View original article here

How to Leverage Behavioral Analytics In Your Growth Strategy

this is a article on How to Leverage Behavioral Analytics In Your Growth Strategy.

Be sure to view the entire note and view the original site

If you’re obsessed with growth, you know how important it is to have a super detailed growth strategy. You and data are BFFs, right? Great, but you also need to understand the context that surrounds that data.

I know that sounds a little dense, but bear with me. What I mean is that information alone isn’t enough. Yes, in data we trust. Sure, lots of metrics are all well and good, but if you can’t leverage that data, there’s no point to it. Think about it. Who makes the growth happen? You might think it’s you, but in the end, it’s actually your audience.

How your users respond to your tactics will decide how successful your growth strategy is. So take a step back and look at your audience. Do you really understand them? Be honest with yourself. Most growth hackers think they understand their customer base, but they only know raw data. Knowing demographics doesn’t mean you understand your audience.

This is where I drop my bomb of a topic. Behavioral analytics, folks.

Understanding and applying behavioral analytics can be incredibly useful for growth strategies. In fact, it could be the energy and edge that your brand has been missing.

Want viral growth? Say hello to behavioral analytics. These analytics give you a look into the minds of your users so you can put yourself in their shoes. You’ll be able to build targeted campaigns that better suit your audience, create messages that reach the right users at the right time, and attract entirely new user bases.

I realize that “behavioral analytics” doesn’t sound all that sexy, but you’re going to discover just how powerful it is. Let’s take a look at some fundamental concepts of behavioral analytics that you absolutely need to know and then explore some actionable strategies you can use.

If you’ve been sleeping on behavioral analytics, it’s not too late. Read this article. Do what it says, and your brand will grow.

What Psychographics Are (and how you get them)

When it comes to behavioral analytics, psychographics are vital.

Psychographics provide a foundational understanding of why your customers behave the way they do.

Demographics are the who. Psychographics are the why.

Each psychographic is a data point that tells you something about your users’ behavior.

Here’s a more comprehensive list of psychographics:

Image Source

These go way above and beyond demographics to give you a fuller picture of your audience.

Psychographics clue you in to your users’ behaviors. For example, if you know that most of your audience is composed of parents of 5-11 year olds, you’ll understand why those kid-sized T-shirts are flying off the shelves.

Although you can’t get any super specific data like number of clicks, you still need psychographics to get a general idea of how your audience acts and why they do what they do.

Psychographics will often reveal what’s important to your users.

Image Source

Do you understand now why psychographics are so important? They help you see your customers as people and not just information from your analytics software.

Speaking of analytics software, you can find some basic psychographic information in GA by heading over to Audience > Interests > Overview.

You’ll see three categories: Affinity Category, In-Market Segment, and Other Category.

The Affinity Category shows you different lifestyle categories. Google compares these groups to TV audiences.

This category points to specific interests that your users have. Even if you just look at this section of GA, you can get a pretty good understanding of what your audience likes.

The In-Market Segment shows you what types of products your users have shown interest in.

Basically, your customers are looking to buy products or services within these categories.

The Other Category offers a narrower view of your audience.

demographics category google analytics

If you want to go even deeper, Google has a handy guide on using this psychographic info in conjunction with other analytics.

There are many other ways to grab psychographics, from surveys to focus groups. Use as many of these methods as you want. Too much psychographic data is never a bad thing.

Still, psychographics are just that––data. You need to use them in a creative way.

With that in mind, let’s look at some growth techniques that depend on psychographics and other behavioral data.

Data-Driven Customer Personas

Creating an imaginary friend might sound a little childish to you, but that’s essentially what you need to do with psychographics.

Right, I know, it’s not exactly an “imaginary friend.”

I’m talking about creating a fictional person who is a representative of your audience base and not just some creature you made up. These representatives are otherwise known as customer personas.

You’re probably familiar with the idea of the customer persona, but if you’re not, don’t worry. Here’s a brief rundown.

A customer persona (also called user or buyer persona) takes aggregate data and uses it to create a fake person. This person is your average customer.

His or her demographic and psychographic information is representative or your audience (or a segment of your audience).

Here’s what an example customer persona might look like:

customer persona

Image Source

As you can see, you can get really detailed with personas. The more detailed they are, the better you’ll understand your users.

By definition, a customer persona is chock full of behavioral analytics. They help you describe the persona in detail.

Once you have all of your behavioral analytics together, you can take a couple of different approaches to creating a persona.

The approach you take will depend on what you want to accomplish with your personas.

Do you want to create better email sequences? Do you want to improve your Facebook ads? Think about your objectives as you create your personas.

Image Source

Specifically, you can use certain analytics based on the results you’re after. Let’s look at some examples of this idea in action.

Let’s say you want to redesign your CRM software to attract more leads. In terms of analytics, you’d want to look for business-related psychographics.

These might include the user’s role at work, how much time they spend at their job, or even the search terms they use to get to your site.

So an example persona for that would look like this one (the one on the right side):

This persona is great for SaaS because it uses analytics that relate to work. There’s little personal information here, but there’s enough to give you an idea of who the persona is.

But that type of persona isn’t ideal for every sort of situation.

Another example: Say you’re the head of growth at an ecommerce apparel startup.

You’d be more concerned with personal behavioral analytics and not so many work-related data. So a persona for you might look something like this:

Image Source

The types of analytics you use should all depend on your goals and the kind of product or service you’re selling.

It doesn’t hurt to get as many data points as possible, but you’ll want to refine them to zoom in on your average customer.

Creating a persona doesn’t take much time, but it can change how you see growth. That said, you have to make sure your personas are as accurate as possible.

If you get the wrong analytics, well, your entire customer journey might just go down the drain.

But if you get it right, your customers will feel like you really know them.

This is a perfect example of how behavioral analytics can make all the difference in your growth strategy.

Remember, you’re not simply looking at a bunch of random numbers. This information has real uses that you can take advantage of starting today.

Let’s take a look at another one of those advantages.

Customer Segmentation

You’re segmenting your users…right?

Okay, maybe you’re not. That’s okay. But you totally need to be.

Some marketers and growth hackers see their audience as one big mass, so every campaign gets sent out to everyone.

But not everyone has the same needs and wants. Your customers are all different.

So if you group people into similar segments, you can deliver more accurate, targeted messages and have better results.

That’s why segmentation is part of every good marketer’s (and growth hacker’s) playbook.

And––you guessed it––behavioral analytics can help you segment better.

The basic idea is to create segments using one or more behavioral attributes.

If you group generally according to behavior, you’ll get an inside look into what different types of customers are looking for.

Image Source

Just this basic behavioral segmentation already gives you a much better understanding of the different kinds of users you have.

All you need to do is a little behavioral research to get started with this. In GA, you can go to Behavior > Behavior Flow to see an overview of the average user path on your site.

While this isn’t incredibly comprehensive, it can prep you for actual segmentation later on. Odds are the trends you see on Behavior Flow will reflect your audience as a whole.

This type of segmentation is flexible and can be used in a variety of ways.

Take email marketing. You can see what emails people open, which people almost never open your emails, and maybe even how long a user spends reading your email.

You probably look at data like this all the time:

Image Source

But have you considered that you can use this information to tap into your subscribers’ brains?

All of those are behavioral analytics in their own right, and they’re great for segmentation.

There’s a lot you can do with these analytics. You can send a special discount email to the loyal subscribers who regularly open your emails, or you can send more targeted emails to people who tend to open one type of email.

And your results are almost guaranteed to improve.

Image Source

The possibilities are endless.

And if you’re using Kissmetrics, you don’t have to worry about any of this because the behavior-based delivery feature does it for you.

Still in doubt? I know it sounds like a lot of work, but it really isn’t, and it can pay off big time.

MailChimp found that segmenting subscribers by interest made every metric soar:

Image Source

If you’re willing to get even crazier with segmentation, get ready.

You can also use behavioral analytics to group your customers by their place in the customer journey.

This concept is a little more advanced than the techniques we’ve gone over, but it packs a serious punch.

The typical customer journey is more or less like this:

Image Source

By using behavioral analytics, you can find out what stage of the customer journey a user is going through.

Behavior Flow can often show this. If someone has checked out lots of your product pages but hasn’t made it to the checkout, he or she is in the consideration stage.

Once you’ve found out where someone is in the customer journey, you can place him or her into an appropriate segment.

Image Source

This approach is a growth hacker’s dream. Not only can you segment your customers, but you can also get a better grip on the customer lifecycle.

It’s awesome, isn’t it?

If you’re serious about converting and growth, you should strongly consider this advanced tactic. It’s one of the best ways to hyper-focus your messages, and you’ll reach the right users at the right time.

Conclusion

Growth is all about people.

And by people, I mean your users.

A good growth strategy has to be centered around your customers. Otherwise, your strategy will fall flat on its face.

If you’re focused on sheer volume and ignore your customers in the process, you’re going to get nowhere fast.

Analyzing and leveraging your users’ behavior is one way to enhance your current strategy.

If you understand your users’ behavior, you can more easily determine what kind of content they want and what kind of messages are best to send to them.

Like I said, it’s all about people. We want to be understood, and we want our needs to be taken care of.

As a growth nut, it’s your job to make sure that happens.

I hope you enjoyed this article on How to Leverage Behavioral Analytics In Your Growth Strategy

View original article here

An integrated approach: From SEO to PPC and beyond

See details of post An integrated approach: From SEO to PPC and beyond below

For most businesses, the summer season means a slow-down in industry events — but for digital marketers, there is no rest! My company was out in force at both The Turing Festival and BrightonSEO this year, both of which represent fantastic forums for knowledge-sharing and networking.

Reflecting on what were hugely insightful conferences, I’d like to run over themes that stood out to me — and how digital marketers can put insights drawn from them into practice.

Attendees of both conferences were spoiled for choice: Speakers from the world’s largest and most inspiring companies, including Google, Moz and Skyscanner, headlined stages. Members of our paid search team were particularly wowed by the session delivered by Wil Reynolds, the founder of Seer Interactive.

Breaking down silos

Wil Reynolds’s background commanded the audience’s attention from the get-go with a story that is still relatively unusual in the marketing world. Originally an SEO expert who turned to PPC, Reynolds suggested that the notion of switching between elements of search marketing shouldn’t be unusual in 2017, but that it unfortunately still is.

Typically, search professionals specialize in either paid or organic search and rarely move from one to the other. However, combining these skill sets can strengthen a marketing team and add value to the services it delivers to its clients.

I think that’s an important lesson for marketers, whether agency or client-side. Integrated marketing strategies are more effective than siloed efforts, and we have no shortage of case studies to that effect here at QueryClick.

Describing how he broke out of his own silo and combined SEO with PPC, Reynolds highlighted how the two areas of search complement each other — a message that resonates with me personally as a marketing professional who recognizes that an integrated approach delivers the strongest results.

A holistic approach

In a modern digital marketing world, however, the merging of skills goes far beyond mastering both SEO and PPC. The way people consume content has drastically changed over the last decade. The rise in mobile media consumption has led to a diverse range of content platforms, and marketers now have extensive opportunities to tailor their messaging and reach their target audiences.

To ensure consistency across platforms, today’s brands demand an integrated approach with a cross-skilled team that breaks down silos, produces more meaningful data and offers them more bang for their buck.

Running organic and paid search campaigns simultaneously (with a single point of truth in reporting) allows integrated marketing teams to define the keywords that have the highest conversion rate and therefore determine the themes that will optimize a brand’s overall digital marketing strategy. To work effectively, however, it must be rolled out across SEO, PPC, social media, PR and conversion rate optimization (CRO), with each team working closely together in order to achieve the brand’s end goals.

Bridging the gap

Of course, there are risks to adopting an integrated approach. There can be a huge disconnect between PPC and SEO campaigns, for example, and work must be done to bridge the gap between both disciplines. Ensuring that the work of the SEO and PPC teams complement each other, and that they can yield valuable data and insights for that work, should result in campaigns that are more targeted and relevant to the brand’s audience.

I’ve written before about how you can integrate paid and organic search behaviour in a blended “Halo” report, and I think it’s just one example where integrating channels provides significant insight value to both channels.

Of course, creating an integrated strategy is an art form as much as it is a science, and without the appropriate tools at hand, it’s not always possible. Power BI, a data visualization tool which can pull deeper integrated organic and paid metrics together, can help marketers present a visual representation of PPC and SEO activity live, allowing both teams to move away from working and reporting in silos and allowing an instantly accessible “single point of truth.”

Get the full picture

During the conclusion of his session at The Turing Festival, Reynolds pointed out that it is important to recognize that SEO and PPC look at the world differently. He described PPC professionals as being akin to “creative accountants,” working to meticulous precision, and suggested that SEOs are more like “poker players,” keeping their cards close to their chest.


Google Search Algorithm Update On September 16th

i wish you like this post on Google Search Algorithm Update On September 16th

Google Algorithm Update

I was incredibly tempted to do a special alert news story Saturday night on a Google algorithm update that seems to have touched down Saturday morning or late Friday but I decided to see how the Sunday chatter around it would be. In short, I noticed an unusual number of people complaining about the Google search results in the ongoing WebmasterWorld thread and some on Black Hat World starting early Saturday.

But Sunday and this morning, the chatter significantly died down. Some say whatever happened Saturday morning, it reverted back the next day. We have seen this before, it may have been a bug or something else but the chatter has 100% died down a lot.

Here is some of that Saturday chatter:

Thing are looking strange today, my bounce rate is up, and my page per session are down, Traffic is down marginally, too early to know for sure if it is significant. This after a few weeks of slowly but steadily growing traffic.

We’re seeing a strong increase yesterday and today (compared to the same days last week), but it’s probably because of the big, big increases in Texas and Florida traffic now that the hurricanes have moved on. (Florida is running 122 percent ahead of last Saturday, for example, and the day isn’t over.)

Things Reverted to poor traffic on FRIDAY 15th and SAT SUN.. so whatever happened has gone back to #@$ now. =/

Total drop in traffic with sessions down over 20% on the week. Must be that “anomalous” overshoot of 4.3 clicks that triggered the hammer. Over the week, data insights were all sunshine and unicorns, yet end of week tally is a loss. smh – perhaps it was the hurricane murmuration. lol

Yes, most of the tools also went nuts on or around Sunday. Here are screen shots:

Mozcast:

click for full size

SERP Metrics:

click for full size

Accuranker:

click for full size

RankRanger:

click for full size

SEMRush:

click for full size

Algoroo:

click for full size

And now that Google says these tools are often right – and we have webmaster chatter – maybe something went wrong on Saturday with Google’s search algorithms?

Feel free to visit this post on Google Search Algorithm Update On September 16th any time

url to original source

Google Search lets readers find e-books at their local libraries

See details of post Google Search lets readers find e-books at their local libraries below

Google just made it easier for readers to find an e-book at their local library.

Per the following tweet from Google, mobile search results for a book now include a “Borrow e-book” option under the “Get Book” section.


Setting Your Customer Engagement Emails on Automation Using Kissmetrics

Here is a article on Setting Your Customer Engagement Emails on Automation Using Kissmetrics.

Be sure to read the entire essay and view the original source

Human attention spans are embarrassingly bad.

I’d be lucky to get just 5% of people to read this entire post. Most probably won’t get past the intro, so I’ll get to the point:

In this age of infinite distraction, brands that can keep their customers engaged with the product are bound for long-term success.

Fads come and go (by definition) and companies have short lifespans. Here one day, closed (or acquired) the next.

Brands that will succeed are the ones that keep customers engaged and re-purchasing.

Companies like Netflix, Facebook, and Amazon succeed, in part, because they keep users engaged. Netflix keeps producing great content, which keeps people coming back. Facebook has a great, addictive product that billions of people use everyday, and Amazon has made billions off keeping customers to come back and make more (and more) purchases.

To keep customers engaged, they’ll need to be informed on what they’re missing without you. To do that, you can send behaviorally-targeted emails towards the relevant group of users.

Here’s how to spot your unengaged users, and get them re-engaged. And this is all done with Kissmetrics.

Just What the Heck is an Unengaged User?

Before we dive into the hows, we’ll first need to know what an unengaged user looks like.

There are active users and there are engaged users.

Active means they have logged in. Even if they login, stare the screen for a few minutes, and leave they can be considered active.

An engaged user is one who uses the product in a meaningful way. They use features, comment on statuses, send messages, and share photos.

Each product will have different conditions of what makes an engaged user, but one thing is for sure – they need to be using the product and interacting with it, not just logging in.

We’ll use a SaaS company as an example in this post. And we’ll set our definitions of unengaged and engaged customers:

  • Engaged – Has used at least 3 features 4 different times in the last 7 days.
  • Unengaged – Has not used any feature the past 14 days.

Now that we have our definitions, we’ll monitor our unengaged users using Kissmetrics Populations and then target them using Kissmetrics Campaigns.

Monitoring With Populations

Populations was created for growth/marketing and product teams to help them keep track of their growth cycle. With just a few clicks you’ll be able to monitor the KPIs that matter to your company.

For this post, we have to goal of shrinking our unengaged user base. So we’ll create Population that tracks the users that have not used any feature in the last 14 days.

Let’s see how many users are in this Population:

So we have our Population in place. Since these are our unengaged users, we’ll want to reduce the number of people in this Population. Let’s take our first step by creating a Campaign.

Send Behavior-Based Email Messages Using Campaigns

Campaigns is one of my favorite features in Kissmetrics. Once you find a segment of users that need to be nudged – whether it’s toward conversion, using features, logging in, etc. – you pull up Campaigns and create the perfect email to nudge them.

There are a number of things you can use Campaigns for. In this case, we’re using it to get our unengaged users in the product and using the features.

In Campaigns, we’ll create a new email message:

And we’ll target the people in the Population we previously created:

We’ll then set our conversion goal. This means that we determine if the Campaign is successful if the users do a specified event. For us, that event will be Used Feature.

We’ll then track the results in Campaigns, where it’ll say how effective the Campaign has been. Here are the results from a different Campaign:

And we can’t forget about Populations. Once we have our Campaign running, we’ll check the Population to see if it’s growing (bad) or shrinking (good).

Minor Interruption

Prefer to just watch our promo videos for Campaigns and Populations? Just hit play below – let’s start with Populations:

And Campaigns:

Conclusion

No matter how sticky your product, there will always be a group of unengaged users.

Even the ultra-addicting Facebook gets unengaged users.

And how do they bring them back?

Through emails.

Don’t believe me? Just get off Facebook for a few days (if you can) and you’ll eventually receive the barrage of emails that come like clockwork.

New friend suggestions, did you see person’s comment person’s status, person added a new photo, and you have 99 notifications, 5 pokes, and 3 new friend requests.

All designed to get you sucked into back and using Facebook once again.

I hope you enjoyed this article on Setting Your Customer Engagement Emails on Automation Using Kissmetrics

View original article here

If Earth Was Even A Fraction Further From The Sun It Would Be Completely Unrecognisable

check out this post on If Earth Was Even A Fraction Further From The Sun It Would Be Completely Unrecognisable

Earth is already a statistical anomaly, something that at present shines out as a blip on the norm of space.

Well a new study looking into the atmosphere’s of exoplanets has revealed just how lucky we really are.

The team from Sorbonne Universitiés has found that were Earth to be just the tiniest amount further from the Sun it would be an unrecognisable, inhospitable ball of ice locked into a permanent ice age.

Lucas Jackson / Reuters

Led by Martin Turbet, the team examined how CO2 would react in planets that were slightly closer or further away from their host stars. What they found was that even a small adjustment further away would cause the CO2 to condense at the poles forming permanent ice caps.

Without any CO2 entering the atmosphere this would drastically alter the greenhouse effect and in turn would fail to warm up the planet’s atmosphere.

What’s worse is the team find that this situation would only get worse if the amount of water ice increased. The CO2 would become trapped under the water ice, permanently, resulting in a planet that would be stuck in a never-ending ice age.

Earth then is in just the right place. It isn’t too far away that its CO2 has been trapped in the ice and yet it’s not too close that the greenhouse effect went into overdrive and the planet became too hot.

Studies like these are vital in helping researchers better analyse exoplanets, some of which have previously been found to fall into what has often been called the ‘Goldilocks Zone’. A window within which planets are capable of forming life-sustaining atmospheres.

So far the number of planets discovered by the Kepler space telescope to a whopping 4,034, 50 of which have been confirmed as being Earth-sized and located within the habitable zone.

Kepler discovers new planets by observing the minuscule drop in brightness that occurs when a planet passes in front of its star.

I hope you enjoy this writeup on If Earth Was Even A Fraction Further From The Sun It Would Be Completely Unrecognisable

see original

Homepages Rarely Convert Because These 6 Elements Are Often Ignored

this is an note on Homepages Rarely Convert Because These 6 Elements Are Often

Ignored.

zamenjeno

Be sure to read the entire essay and view the main source

No, this headline isn’t clickbait.

This article does contain critical homepage elements that are often overlooked. And you might be ignoring them. In fact, the examples I share here are a sure sign that many marketers still ignore critical homepage elements. And conversions are lost for these simple reasons.

I’m not going to rehash what you already know about homepages.

You are a smart marketer. You already know a homepage is your website’s front door. It’s where most of your customers expect to find the #1 thing you do that can solve a specific problem for them.

Okay, enough talk. Here are six homepage elements you’re probably overlooking that are costing you conversions:

1. Homework (a.k.a. doing customer research)

Homework ‘on people’, that is. And yes, it’s a homepage element—because it shows when you do it well.

Imagine this for a second: Your high school teacher assigns you homework and asks you to submit it in three days. For the next two days, you stay up late and wake up early to deliver your best. You faithfully turn in your homework on the third day.

Question: How long would it take your teacher to score your work? A few seconds to five minutes. That’s how long it will take to score something you worked on for days.

It’s the same with your homepage. Your homepage (or even any landing page for that matter) is like homework given to you by your target audience. It takes them a few seconds or minutes to score you, before deciding to bounce or stay.

Homework shows on your homepage—because, if you do it, your copy will be saying what your prospects want to hear. If they land on your page and find that you’re not speaking their language, it shows you haven’t done your homework, and things can get ugly. You may even leave such a bad impression that they make a point of not going back.

Example, Ashdown People—a firm specializing in HR for IT businesses:

If you’re a tech firm who visits this page for the first time, here are a couple of questions you’d naturally have in mind:

  • What does Shaping The Digital And Technology Workforce mean?
  • How are you shaping it?
  • What’s the exact HR problem that this brand solves for IT organizations?

The page looks nice, but imagine the confusion its visitors may be experiencing.

In contrast, take Solertia — another HR firm:

Their homepage copy speaks directly to a specific challenge folks running HRs face—developing compensation strategies to avoid losing key talent. This will catch the attention of an HR pro because it deals with problems that hurt and offers a solution.

This is a good example of someone doing their homework. Whoever wrote this copy studied their audience well enough to find that ‘developing strategies to keep key players in an organization’ is a goal HR departments always try to reach.

Doing your homework on your target audience reflects in your messaging.

How do you do your homework? Talk to the very people that visit your homepage: customers. In other words, get feedback. There are great tools that will help you here, some of which include:

  • SurveyMonkey: Create surveys and generate quality feedback.
  • Kampyle: Get feedback from users.
  • Get Satisfaction: Build a forum where customers talk to one another about your product, while you just watch, listen and act accordingly.
  • AnyMeeting: Schedule live meetings with customers and get actual feedback from them.
  • IdeaScale: Allows users to make and vote suggestions about your product. And feedback with the most interactions gains higher recognition than others.

These tools will help you know your customers’ pain points, goals and how they will need your product to solve their problem. Then, you’ll be able to create a homepage (and even any other landing page) that speaks directly to those problems.

Next, brevity and clarity.

2. Brevity and Clarity

Brevity doesn’t necessarily mean copy is short. It does imply there are no redundancies, and yet enough clever repetition to convince visitors to take a specific action.

Chris Garrett, Chief Digital Officer at Rainmaker Digital, wrote that a landing page should be, “as long as necessary. And no longer.”

That’s brevity. As long as necessary. No longer. And clarity, on the other hand, is self explanatory enough. Is the problem you solve for your audience crystal clear?

When your homepage doesn’t briefly and clearly explain your offerings, people lose interest. It’s that simple.

Another case in point is where you have brevity on your homepage, but not clarity—a case where your homepage copy is brief, but it isn’t clear how visitors will benefit from your business.

A typical example of that is ZOHO’s homepage:

It’s a well-designed page and it sure is brief, not much to read here. But to me, it lacks clarity.

If, like me, you knew nothing about ZOHO before visiting their homepage, you have no idea what The operating system for your business OR A revolutionary all-in-one suite to run your entire business means. If you’re curious, though, you might want to click the “learn more” link to find out.

But according to some sites, Zoho gets about 18 million monthly visits. What if 400k, 1mm, 5mm … of those monthly visitors aren’t curious enough to click learn more? They were probably looking for a specific solution before landing on this page, and that’s what they expect you to communicate to them.

Your best bet is to communicate whatever you’re offering in the clearest and shortest way possible. A perfect example of “brief and clear” is Google My Business’ homepage:

In just over 20 words, with an image on the side, Google My Business clearly and briefly explains how they help your business get found when your brand name is searched.

So brevity and clarity could mean five, ten, 200 words. What matters is that your page provides enough information for your visitors to become convinced and take action. And this why not hiring a good copywriter for your business is a terrible idea. A good copywriter will do enough dirty work to produce copy that has both brevity and clarity.

3. Active voice on CTA Buttons

(Active voice describes a sentence where the subject performs the action stated by the verb.)

In other words, a CTA button with active voice is one that says, “This is what will happen when you (the visitor) click this.”

And active voice goes beyond just using verbs on your CTA.

It’s easy to think that all visitors understand what a colored CTA button means, but you’d be surprised. Sign-Up.to recently mentioned in their study that “Images are good, but it’s not always clear that the image is also a call to action.”

Just because you have a colored button on copy doesn’t mean visitors know where the button will lead when clicked. Example:

Where will Click Here lead when clicked? Is that button for a call, an email, or a link to another page? You need to let people be certain what your button is for, or you risk confusing people.

Here’s a perfect example of that from Toyota:

“Explore Prius” is active voice. It says exactly where the CTA will lead after it’s clicked—a page where you get to explore the Toyota Prius.

That’s active voice in action. Don’t put your visitors in a position where they’re not sure what your button is meant for. Make it as descriptive as it needs to be — Explore [my product], See a demo, Check out this case study, etc.

4. Specificity Over Hyperbole

Why not hyperbole? Because overstating can lead to visitors questioning your sincerity.

Instead, use copy that specifically communicates how you actually add value to people’s life and businesses. Twilio’s homepage is a good example:

Twilio is a tool that software developers use to add communication capabilities to the applications they build. And that’s exactly what they explain in the homepage: “Build software that communicates with everyone in the world.”

No overstatements. No hyperbole. Just the specific problem Twilio solves for people.

Hootsuite’s homepage is another good example:

According to SEMrush, Hootsuite gets about 7.2 million monthly visits. That’s impressive; yet, there’s no mention of how big they are on the homepage, but a brief and clear explanation of how their product solves problems for people.

Adding hyperbole to your copy doesn’t communicate any value. ConversionXL Founder Peep Laja says it this way (54:21): “You don’t add life to copy with hyperbole. [For example,] ‘We have the best pizza in town VS. We deliver pizza in 10 minutes’. [Pick] specific [over] hyperbole”.

5. Testimonials With Smiling or Happy Faces

Testimonials are powerful already, but one with a smiling face pictured? Terrific!

One Swedish study reveals that your smile has a huge effect on people around you — try smiling at someone and you’d see they almost couldn’t help but smile back, unless they consciously don’t want to. Amazing, eh?

Pipedrive laid emphasis on the fact that their customers are actually happy people. Then they put those happy, smiling faces about 40% down their homepage.

Kissmetrics understands this concept as well:

So, if you’re going to use testimonials with customer headshots, use those that are smiling already since they have a positive effect on viewers.

6. One Page, One Goal

You’d think every marketer by now gets the concept of one page, one goal, until you see a homepage like this in 2017:

Several CTAs on one page. What’s the one goal that a page like this is trying to achieve? Virtually everyone would have no idea. And several studies have proved it’s far better to use one page for one result. The more specific you are, the better you’ll be at converting specific visitors.

A good example of a homepage with one goal is this one on QX Recruitment Services:

In contrast to HR Consultants homepage (above), this one has only one goal. Which means if the homepage gets 2000, 5000, 20000, etc. monthly visitors, this report will be the number one thing catching their attention. And it’s the only action they’re first asked to take. Brilliant.

This way, QX Recruitment Services know how to measure the homepage’s success — it’s as successful as the number of downloads the report gets.

Start Converting With Your Homepage

I hope you enjoyed this article on Homepages Rarely Convert Because These 6 Elements Are Often Ignored

View original article here