Can Robots Do A Better Job Of Building Peace?

check out this post on Can Robots Do A Better Job Of Building Peace?

Every day it seems I read an article about the march of robots into our jobs and our lives. They can drive cars, milk cows and make burgers, apparently. And often, enthusiasts claim, they will do these jobs better than us flawed human beings. Logically then, let’s turn to robots to solve our most intractable problems. Human beings seem unable to kick the habit of fighting and killing one another. Enter the peacebot.

In our increasingly uncertain world, more than one in five people’s lives are affected by the rising conflicts, over 40 wars are being fought and we face the greatest humanitarian crisis of our time. Those who believe in division and foster hatred have grabbed the microphone and are dominating the airwaves. It is time that all those who work quietly for peace raise their voices more loudly too if we are to be heard over the cacophony of hatred. So to celebrate UN International Day of Peace on 21 September, at International Alert we will be creating and letting loose a flock of peacebots who have been programmed to tweet away their messages of compassion supporting #peaceday.

It’s a fun action, and one that reminds us how our everyday actions can contribute to peace. As Martin Luther King said: ‘We can very well set a mood for peace out of which a system for peace can be built’.

Both the mood and the system for peace are badly needed urgently, with recent figures showing the amounts invested in proactive measures to prevent violent conflict, to bring people together and to rebuild after war are absolutely dwarfed by the towering expenditure on the military. The Global Peace Index estimates total expenditure on peacebuilding at around $10billion in 2016, just over half a percent of the $1.72trillion global military expenditure. It would be a joke except it isn’t very funny.

2017-09-18-1505753135-1490644-Organisation_RedressingTheBalance_WarCost_EN_2017.jpg

That is why we are calling on global leaders to at least double the current amount spent on building peace. We know that money will be well-invested. In a report published on International Peace Day, we have surveyed the literature and case-studies to see if there is evidence that peacebuilding does work. And the evidence is there.

Of course, peacebuilding is no recipe for immediate success. There are countless examples of when governments and communities turn their backs on dialogue, preferring die-hard habits, to pick up their trusty AK47s or to send in the troops. That is why some conflicts such as in the Philippines, have dragged on for over half a century.

But there is also extensive research and a myriad of evidence-based examples showing how peacebuilding has tangibly contributed to reducing violence and helping communities and nations rebuild and reconcile once the guns have fallen silent. From training provided to Muslim and Christian community leaders in the Central African Republic, improved political collaboration across sectarian lines in Lebanon, through to mediating land conflicts in the Philippines and community-friendly policing in Afghanistan, examples abound of initiatives that have demonstrably contributed to reconciliation or resilience. At a macro level, our report shows how a range of initiatives contributed to a critical mass of energy for peace in Northern Ireland, Nepal and South Africa.

Obviously that is good news for people. But it also makes hard economic sense. According to the Institute for Economics and Peace, every $1 invested in peacebuilding, reduces the costs of conflict by $16. Clearly, conflict costs, and peace pays.

2017-09-18-1505753348-2128302-Organisation_RedressingTheBalance_PeacebuildingSavings_EN_2017.jpg

At the UN and many member states, the rhetoric on peacebuilding is good, sometimes very good. But it just isn’t yet backed-up by the hard cash and serious policy follow-through that would deliver results. New polling by Conciliation Resources and the Alliance for Peacebuilding shows that this would be popular. In the UK over seven out of ten respondents believe that peacebuilding plays a vital role in ending violent conflicts, and six out of ten state that the UK should be investing more in peacebuilding. The responses were even higher in Germany. And in the US, 74% agreed that peacebuilding plays a vital role in ending conflicts and supported greater investment in it – a significant finding in light of threatened cuts to peacebuilding budgets.

So we will be knocking on the doors of governments around the world, showing the evidence that peacebuilding works, is popular and even cost-effective. And meanwhile, we will also be getting on supporting all those communities who undertake every day peace actions: from the brave people gathering in the park in Yangoon to call for peace in Myanmar, to the refugee teachers giving traumatised children a chance to play again. These everyday actions deserve our support. Now more than ever. Let’s hope the peace bots do a great job at creating that mood for peace and that our humanity catches up.

view original

Why Segmentation is Vital to Your Marketing Success

Here is a article on Why Segmentation is Vital to Your Marketing Success.

Be sure to read the entire note and view the main source

When I say “segmentation” with regards to marketing, what comes to mind for you?

Chances are, you immediately think of email segmentation. Segmenting your emails is crucial to improving your customer engagement and conversion rate.

But although emails are the most widely talked about segmentation type, there are countless others. Unfortunately, it’s a process that’s little-used beyond the realm of email marketing. Let’s take a closer look at the various marketing channels that can (and should) be segmented for better results and why segmenting as a whole is so important.

Email Segmentation – Where It All Began

Email is one of the oldest and most-used marketing methods, so it’s understandable that companies have collected and analyzed a great deal of data regarding their subscribers.

These days, segmenting your emails — by customer group, purchase history and other actions your subscribers did or did not take, is a no-brainer. A study by MailChimp and Marketing Charts even looked at the data to determine just how much of an impact list segmentation has:

Image Source

From opens to clicks to abuse reports and unsubscribes, rates across the board were improved for segmented versus non-segmented. Of course, this should come as no surprise to seasoned marketers — still, having the numbers is better than pure guesswork.

But what about segmentation in other areas — beyond email?

Wouldn’t it stand to reason that if you could also segment other parts of your marketing, you’d get results that are just as solid? Let’s take a closer look:

What to Look For With Segmentation

Just like with email list segmentation, segmenting your other marketing techniques should be rooted in the data you’re collecting. Don’t just skim over your analytics reports. Dig deeper and look at the big picture as well as the individual pieces. Chances are, there are some small but highly engaged groups that may stand out. Here are some common areas that may stand out:

  • Geography – You can use this demographic for multiple areas of your marketing. Are more users from a certain country converting at a higher percentage than others? Is the paid traffic from Indonesia converting? Segment your paid traffic and organic traffic to see which markets are outperforming and cut off funding to countries that don’t convert.
  • Device type – Many marketers may be looking at their overall conversion rate without segmenting by device type. Do significantly more conversions happen on desktop than mobile? That may be a signal that your mobile site needs work.
  • Product category – E-commerce companies may want to dig through the data on their first-time purchasers. Is there a particular item that they like to order? If one stands out, you may want to use that in your paid marketing to see if those ads outperform others.
  • Signup type – SaaS companies frequently have a couple different ways to convert visitors to prospects – they either signup or request a demo. Build a funnel through the buyer journey – from first visit to paying – and see if you get more paying customers from either signups or purchases. If one significantly wins over the other, you may want to make that your only signup method.
  • Marketing channel – Think about all the different channels that are sending traffic your way. You have paid channel (and multiple channels within that – facebook ads, adwords, etc), organic search, referral traffic (backlinks), email, social, and more. Breakdown your site traffic and conversions by channel.

By the way, you can do all of this in Kissmetrics.

What Else Can You Segment?

The real question is — what can’t you segment? With the right analytics foundation, you can split test, monitor, track and analyze almost anything. Every attribute a person has – what city they’re visiting from, what browser they’re using, what time they visit, gender, etc can be segmented. The key, however is that you find the key segments that matter so you avoid analysis paralysis.

Beyond email marketing, you can (and should) create segments for your funnels and even your revenue to see which groups are engaging with which test, how far along they are in the funnel and what they’re buying.

But when it comes to segmenting these other things, it’s easier said than done, right?

The good news is that Kissmetrics allows you to segment and analyze nearly any data you can collect. There are a few Kissmetrics reports that can help you with identifying the key segments in your business.

1. Funnel Report

The Funnel Report is used to identify the roadblocks that are preventing visitors from converting. Part of the power of the Funnel Report is the segmentation. In the image above, we’re segmenting by the marketing channel the visitor came from. With this level of segmentation, we’ll find the key groups of visitors that are dropping off, or performing well throughout the funnel.

Each table below the funnel shows the actual segmentation. At a glance, you can easily monitor and judge performance based on your own segmentation criteria.

2. Cohort Report

The Cohort Report lets you see how user behavior changes over time. This is particularly helpful for seasonal businesses, but can still be used even if you don’t focus much on seasonality. See how user behavior changes week after week – including purchases, signups and other criteria. This gives you at-a-glance insights into your next steps to ensure you target the right segments at the right time with the right offer.

3. Activity Report

You can think of this as the “Segmentation Report”. You pick an event, and then segment it. Then drill down further to truly understand what’s driving each action.

4. Populations

View original article here

Daily Search Forum Recap: September 20, 2017

i wish you like this article on Daily Search Forum Recap: September 20, 2017

url to original source

SearchCap: AdWords second line, Bing ad extensions & Google AdWords Editor update

See details of post SearchCap: AdWords second line, Bing ad extensions & Google AdWords Editor update below

Below is what happened in search today, as reported on Search Engine Land and from other places across the web.

From Search Engine Land:

  • AdWords Editor update supports Shopping Showcase Ads
    Sep 20, 2017 by Ginny Marvin

    Create and edit the newest Shopping ad format in Editor.

  • Looking at marketing automation platforms? We compare 14 vendors
    Sep 20, 2017 by Digital Marketing Depot

    Virtually every marketing automation platform provides three core capabilities: email marketing, website visitor tracking and a central marketing database. From there, vendors begin to differentiate by providing additional tools — which may be included in the base price or premium-priced — that offer advanced functionality. This MarTech Today buyer’s guide compares 14 leading B2B marketing […]

  • Anatomy of a Google search listing
    Sep 20, 2017 by Stephan Spencer

    There’s no perfect method to snagging the top overall search result for every relevant query, but columnist Stephan Spencer believes that understanding each element of Google’s search listings can give you the best chance for success.

  • 3 reasons SEO is the account-based marketer’s secret weapon
    Sep 20, 2017 by Nate Dame

    A lot of B2B brands are discovering the powerful influence of account-based marketing (ABM) strategies, but is it enough? Columnist Nate Dame outlines why ABM needs SEO, and how they’re better together.

  • Account-level ad extensions now available in Bing Ads
    Sep 20, 2017 by Ginny Marvin

    The update is currently rolling out globally.

  • Ahead of the holidays, Google Merchant Center sees substantial upgrades
    Sep 20, 2017 by Greg Finn

    Tools to edit values, conform to specifications and list in multiple countries make modifying feeds easier than ever.

  • Google kills test of second description in search ads
    Sep 20, 2017 by Ginny Marvin

    The additional line of ad copy is no longer eligible to display.

Recent Headlines From Marketing Land, Our Sister Site Dedicated To Internet Marketing:

Search News From Around The Web:

Industry

Local & Maps

Link Building

check out here

5 Lies You Tell Yourself About Your Analytics (And How to Fix It)

this is a note on 5 Lies You Tell Yourself About Your Analytics (And How to Fix It).

Be sure to view the full note and view the main site

Consulting data is good.

But being a slave to data is not.

There is such a thing as being too data-obsessed. Confirmation bias pops up. And you miss the good, albeit, intangible stuff that comes along with your efforts.

The solution is to uncover those biases and misunderstandings that lead you astray.

It’s not easy. Or even intuitive. But it’s the only way to avoid these five analytics blinders.

Here’s how it strikes when you least expect it.

Here’s why you fall for it.

And here’s how to avoid it by bringing in other types of feedback and analysis.

Lie #1. Your “Conversions” Are Flawless

You’ve got three AdWords campaigns.

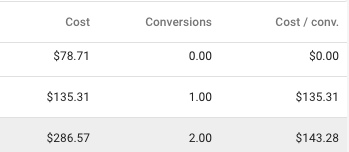
  • The first brings in zero leads on $78 bucks spent.
  • The second brings in one at a cost of $135.31.
  • The third brings in two at $143.28 per lead.

Nine times out of ten, the campaign with more “conversions” is declared the winner.

But what do you really, truly, know about this scenario?

Which campaign is actually performing the best? Which is putting the most money back into your pocket?

There’s simply no way to tell at this point.

First and foremost, these “conversions” are leads — not closed customers.

Second, they might be for different products or services. So different average order values or LTVs come into play.

Third, this is nowhere close to statistical significance. For example, the third campaign has the most leads because you’ve spent the most money on it.

Not because it’s “better.”

What if you simply spend the same amount on the first two? What if you let them both get to around the same ~$150/per mark?

See what I mean?

Too many “what ifs” for my taste.

Yet this is exactly what happens inside any marketing department. The same end result pops up after each client or superior meeting.

Everyone points to the third campaign. It gets the adulation. It gets the increased budget. It gets the additional staff and resources.

So it becomes a self-fulfilling prophecy.

One solution to figure all this out is closed loop analysis.

Ideally, your goal is to match up the customer’s information (name, email, phone, credit card) to the lead data you’re seeing inside Google Analytics.

Haha — just kidding.

That would mean you were gathering Personally Identifiable Information, which is a big no-no in Google Analytics.

Do it and they’ll delete your account right away.

The simplest alternative is to just use a tool that gives you this power, without jeopardizing your data. Hint, hint.

Lie #2. Your “Top” Traffic Sources

What are your top sources of traffic?

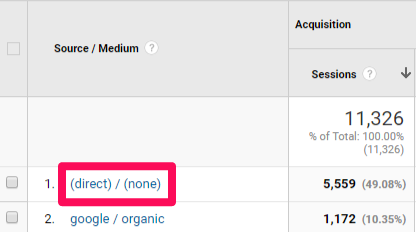
A quick glance inside Google Analytics usually tells you (1) organic search and (2) direct. Maybe a little (3) referrals thrown in for good measure if you got some press last month.

Here’s the problem.

Two of those three are legit. The other is not.

The problem is that your direct traffic isn’t, in reality, all that “direct.”

Technically, this should be the number of people typing in your website URL to the address bar and hitting “Enter.”

Instead, it’s a healthy mix of email, social media, and good ol’ organic search.

The bigger the site, the bigger this problem usually is.

For example, The Atlantic couldn’t account for or explain how 25% of their visitors came to their site.

One of the biggest publishers in the world. One of the most respected. Who gets paid based on the number of visitors and page views they get. Has no idea how a quarter of their traffic is getting to their site.

That ain’t good.

But how can you really tell where people are coming from, if most analytics programs can’t tell you with any degree of accuracy?

For instance, let’s say your new, fantastic-looking email campaign is about to go out.

It’s been given the green light. “Legal” gives you the A-OK.

But wait! You didn’t tag the promo links correctly.

Now, you’ve spent all that time on a campaign that won’t have anything to show for it, because the traffic you get will now end up in the dumpster pile officially known as “Direct traffic.”

This isn’t just an email. It affects each and every social message, press mention, and blog post referral, too.

It can even affect your organic search traffic.

Groupon found this out the hard way. Literally. By completely de-indexing themselves for a few hours.

What did those crazy couponers find? That nearly 60% of their direct traffic was actually coming from organic search.

Sixty-freaking-percent.

But don’t freak out just yet. There are solutions here.

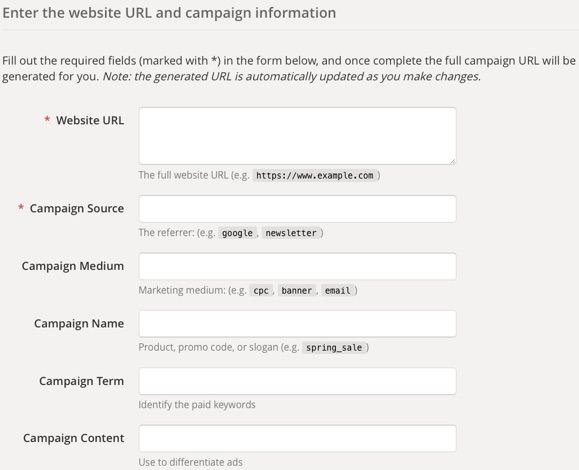
First, you can use Google’s UTM builder to make sure you are properly tagging your links. This means any and everything you have control over.

Manually tag them before they head out the door, or copy & paste into a lightweight app like Terminus.

If you’ve got long, cumbersome URL, you can be pretty sure that any traffic to that page didn’t come from Direct traffic.

People aren’t going to remember it. Which means they aren’t going to just spontaneously type it in.

Instead, these peeps probably came from another place, like an organic search or email.

However, in the same breath, you can probably consider homepage traffic to be legitimate Direct.

So create a segment based on these URLs and traffic sources to pinpoint “Dark Traffic” in its tracks. And prevent it from ruining your data in the future.

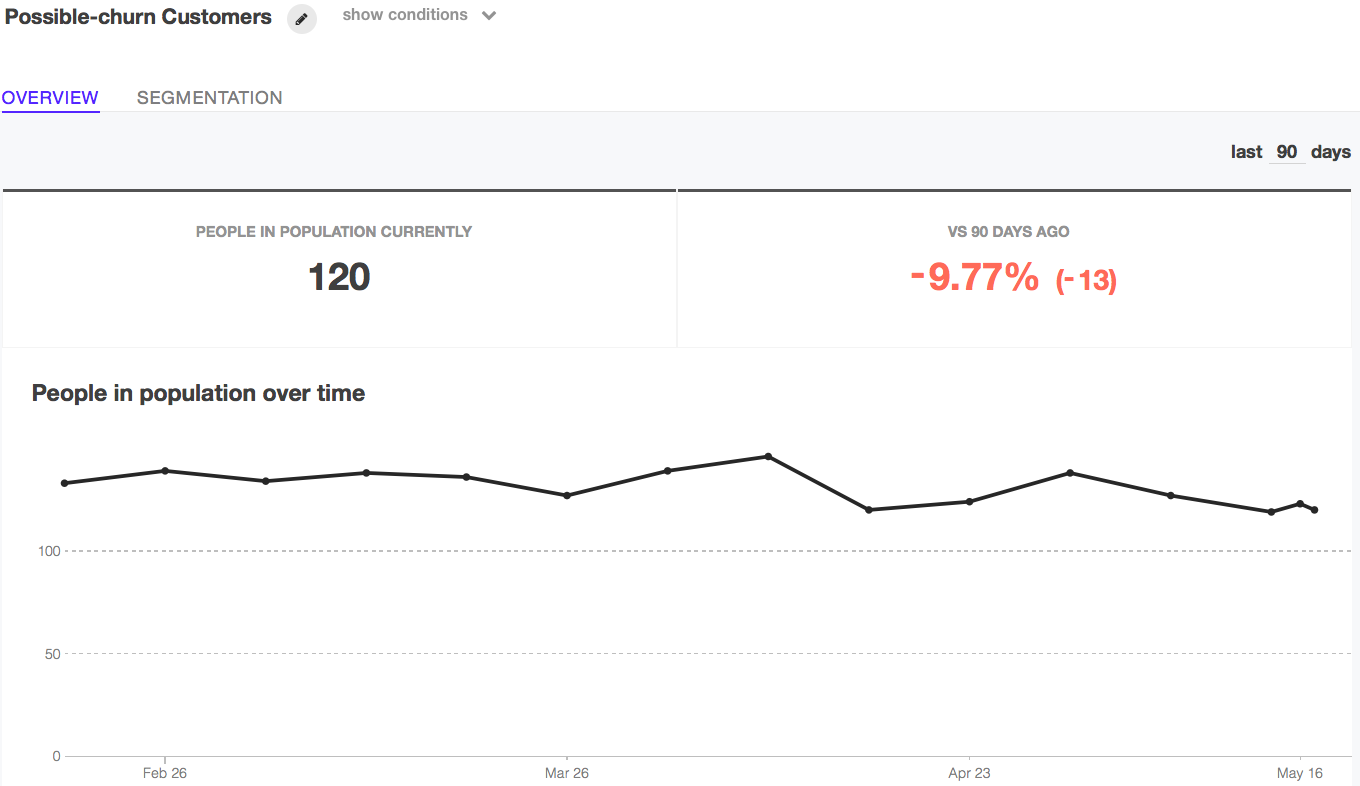
Lie #3. Top of the Funnel Performance = Results

Yes, we want traffic.

Yes, we want pageviews.

They make us feel all warm and fuzzy and proud. Like our hard work isn’t going unnoticed.

But they should not be the end-all, be-all.

Use them to see how you’re doing over last month. But don’t misunderstand numbers to be the Holy Grail, either.

Like this, for instance:

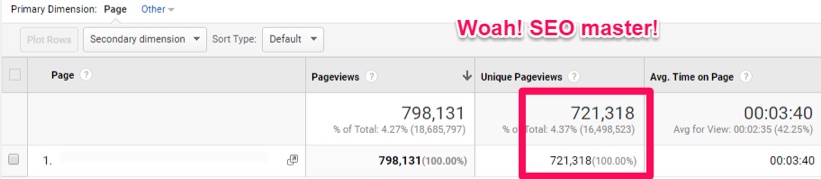
Looking at only this, you walk away feeling like a boss for all the numbers you’ve racked up. Seriously, I can’t even count that high.

But what about when you consider the bounce and exit rates for each of those pages? Are people staying? No? Color you embarrassed.

Are you still so excited by your thousands of pageviews if most of them left immediately?

Bounce rates are real. And you’ve gotta consider them when you are looking at your metrics.

They mean that people haven’t had the chance to interact with your soft micro conversions. They haven’t had a chance to activate.

So take a look at the big picture.

Are your blog posts and site pulling people in, but not making them stay?

This isn’t a horrible problem to have, because it’s a problem you can pinpoint.

The traffic is there. They just don’t really like what they are seeing once they get to your site. Which you can fix.

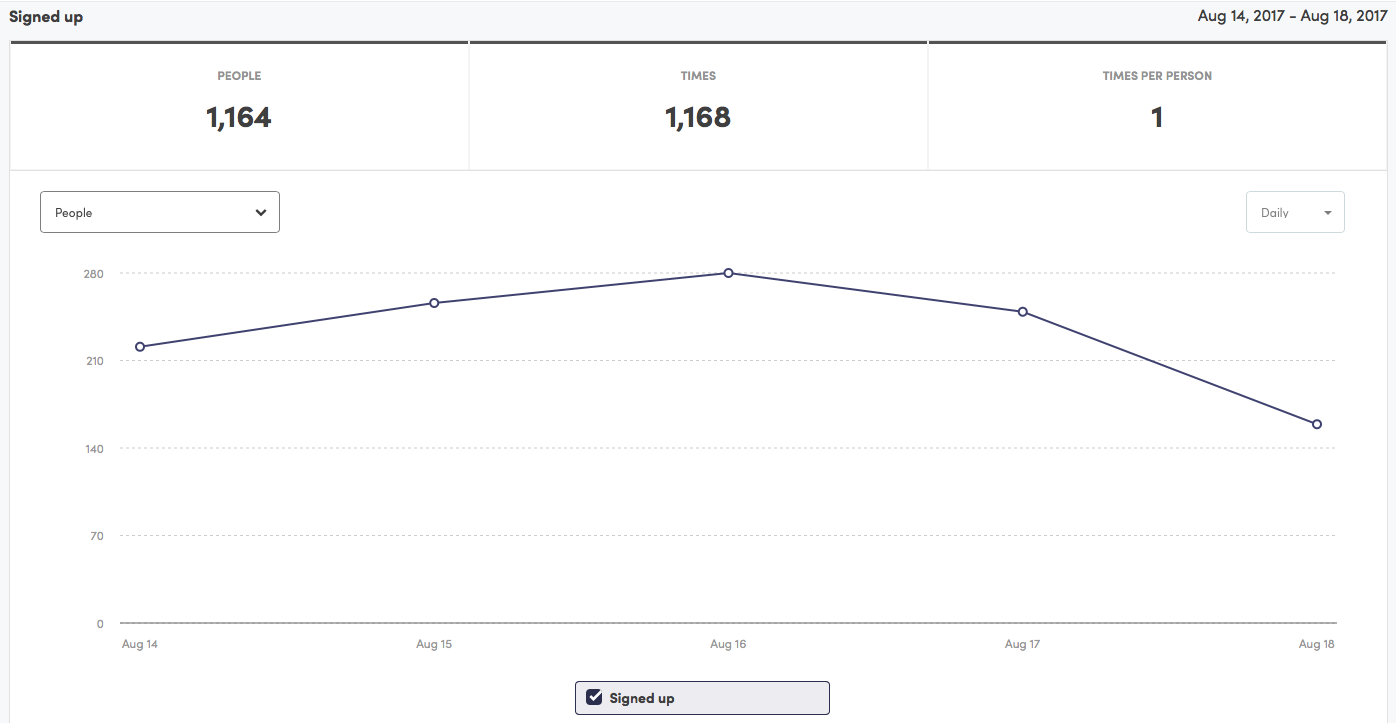
First, set up some events to get a better idea of what’s happening on your pages. Then, make sure you have actionable goals that will allow for movement you can track.

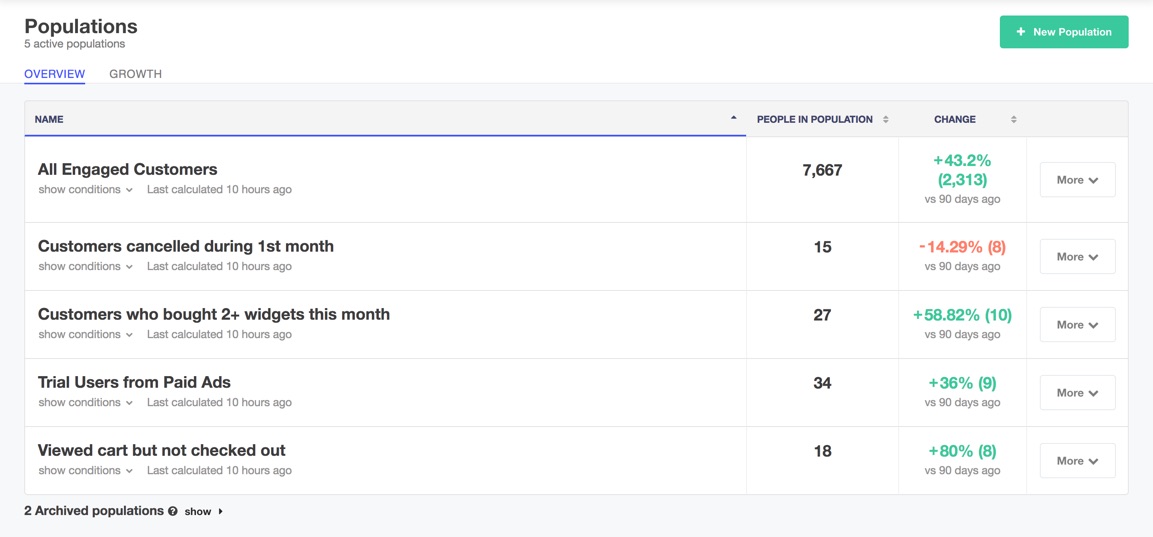
Or use the Kissmetrics’ Customer Engagement Automation tool to analyze what people are actually doing on your site and with your products. Then, you can interact with behavior-based messaging to keep them around longer. Or keep them coming back for more.

That way, you can increase conversions, engagement, and retention without the guesswork.

kissmetrics populations

Just always remember that numbers don’t tell the whole story. Use them with a grain of salt and a little bit of context.

Lie #4. Deceptive A/B “Wins”

I’m just going to be honest with you. Those A/B testing “wins” you just got? Don’t always have the best track record.

I’m sorry to be so harsh right off the bat. Sometimes the truth hurts.

What’s even more worrisome? Oftentimes, tests will look like they have succeeded. But that’s not always the case (or at least, not the whole picture).

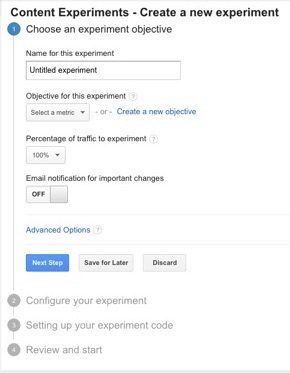
Start with Google Analytics content experiments, instead.

You can use it to contrast your varying pages to see if there are any sizeable adjustments that cause positive changes.

Instead, it allows you to compare different page variations to see which ‘bigger’ changes result in improvements. Maybe this works a little better because it adds an extra letter– it’s an A/B/N test.

content-experiment-step-one

The problem with this test is when you get a little too grab-happy.

You can quickly and easily remove fields to get better results, for instance. A simple reduction of three fields will increase your conversions by 11%.

Or, you can take away specific conversion-busters like the need to add a credit card for a non-paying trial. Sure, this will up your “conversions.”

But remember how far that got you a few lies ago?

That credit card field you took away? It was a huge indicator for which of your customers will eventually buy. 50% of people who put in their credit card will end up converting. While only 15% will of those who don’t enter a credit card will.

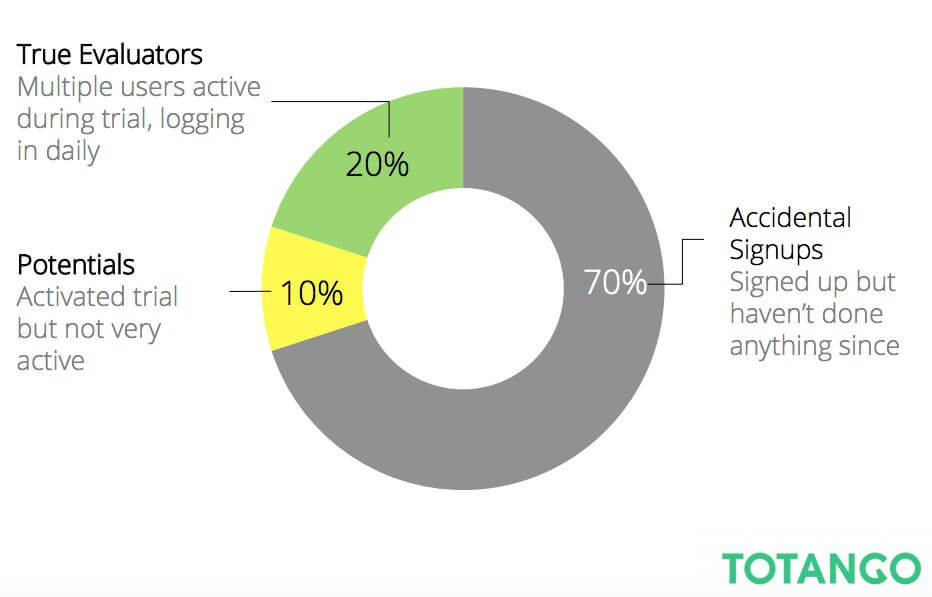
And we’re talkin’, conversions-conversions here. Like, bottom-of-the-funnel, paying customer conversions.

Context is key when you are looking at analytics.

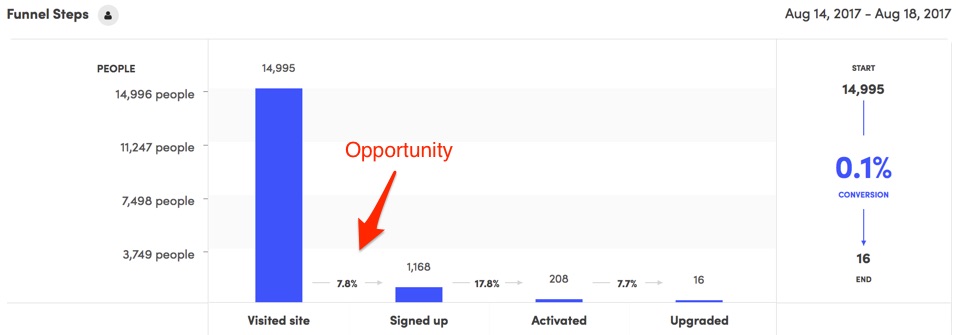
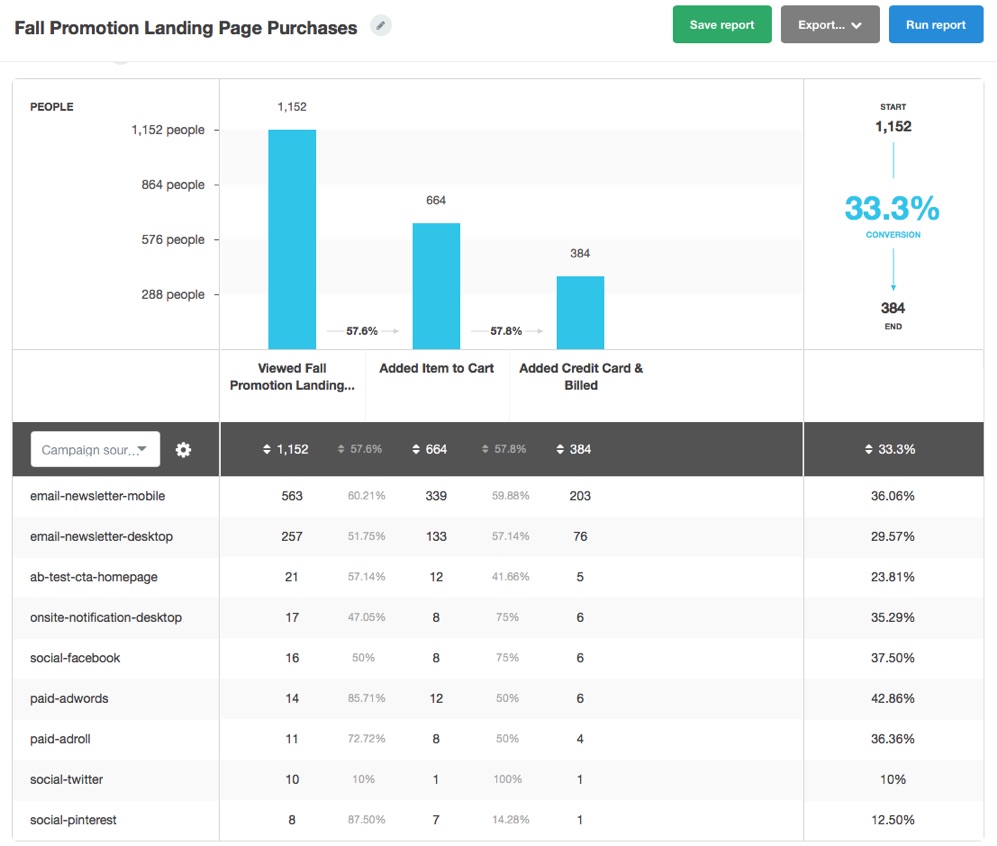
Don’t test landing pages or simple changes to fields while only evaluating the top of the funnel. Make sure you dig in to see how the changes affect the rest of the customer experience and journey.

To do that, use the Funnel Report so you can see exactly how top-of-the-funnel changes are impacting bottom-of-the-funnel sales.

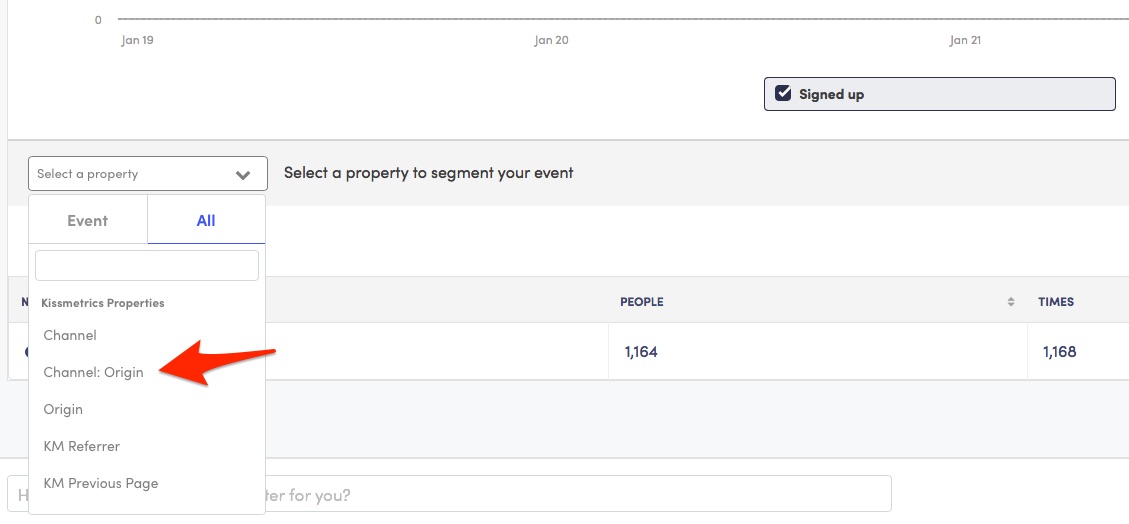
Lie #5. Your Channel Source Attribution

A Forrester Research study years ago found that 33% of all transactions of all transactions happened after new customers had gone through more than one touchpoint.

That number jumps to 48% when considering repeat customers.

The same report showed that paid search is the highest source of conversions.

Is it, though?

Or is it just the last point most commonly used before a sale?

Just because it’s the last one, doesn’t mean it’s the only one.

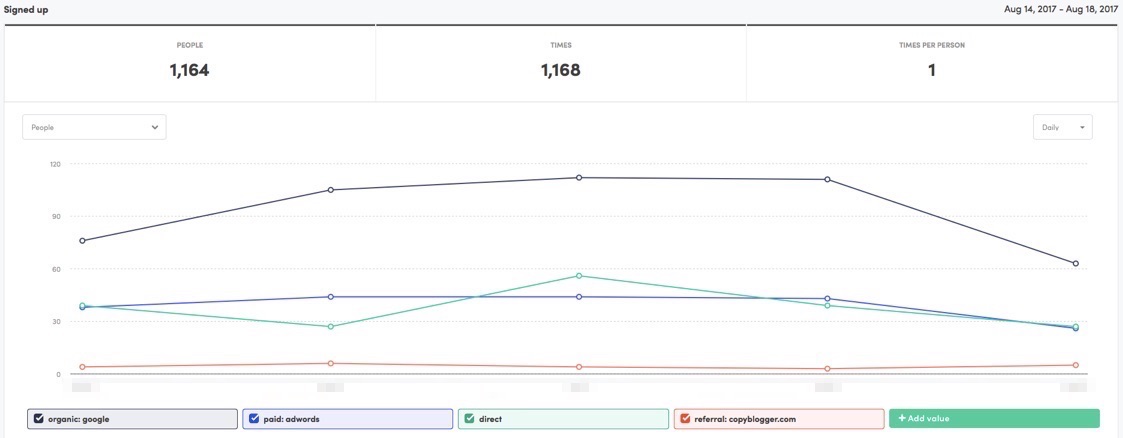
What other marketing tactics are working to increase growth? Forrester went on to declare that while email works for repeat conversions, social media brings in less than 1% of sales.

Ok. Then how do you explain SpearmintLOVE?

You know, the freaking baby blog that boosted their revenue by 991% in year using Facebook and Instagram.

The only reason I know about them? Because my wife has bought clothes from them. After discovering them on Facebook and Instagram.

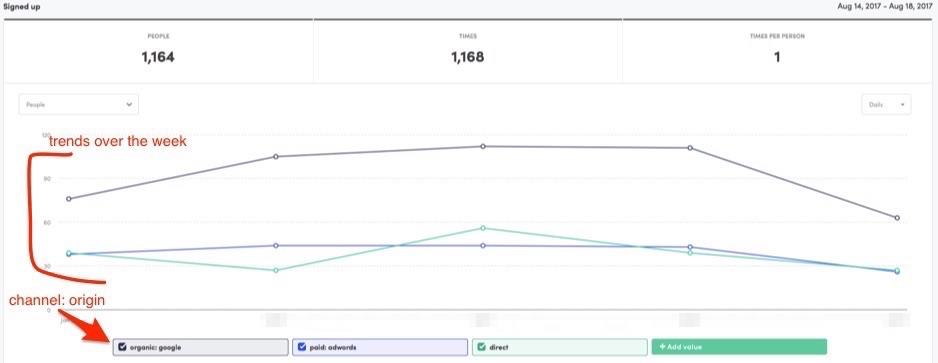
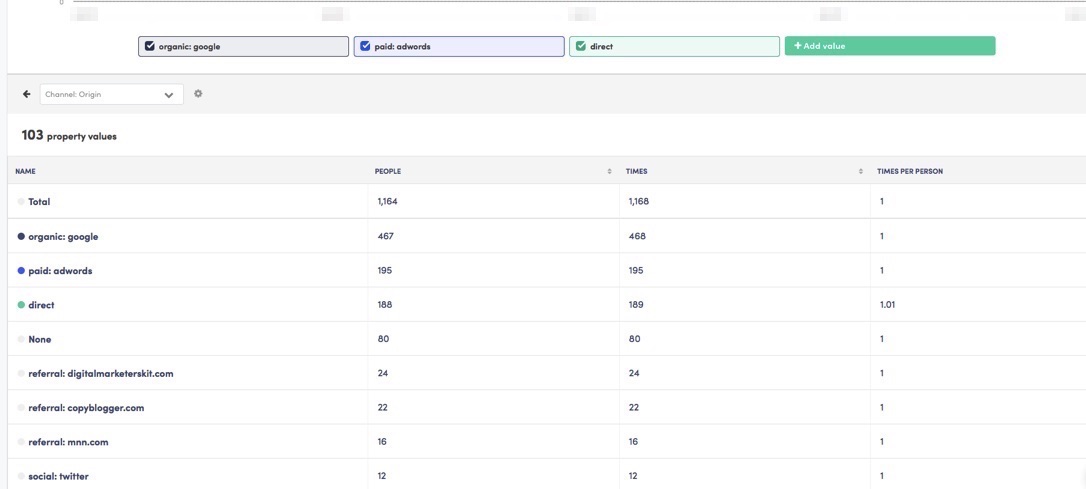
One, simple Google graph puts this myth to bed. Fast.

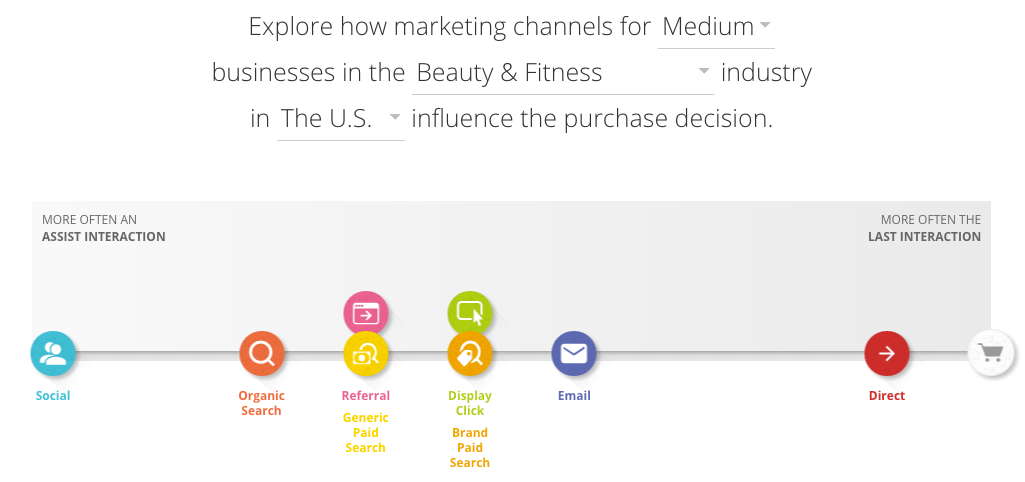
If you look at the left side, or “assist interactions,” you’ll see that social channels will put new products in front of people.

As you move toward the middle, customers get more information about products and options using search. At the end, they’re on their way to the website.

Notice all the possible interaction options here. It’s not just the last-touch that brought the customer to the website. They can take many steps to get there.

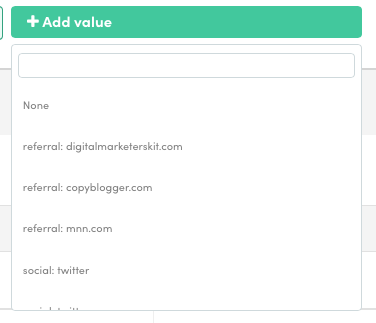
Google Analytics has a few different attribution options built-in to help you change how conversions are assigned.
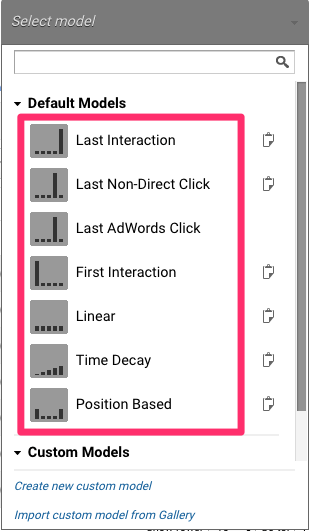
Image Source

These include:

  • Last Non-Direct Click: This will overlook Direct clicks and go to the channel used right before.
  • First Interaction: This uses the social or advertisement that got them to the website.
  • Linear: Here, each channel that a customer used before purchasing will get equal attribution.
  • Time Decay: This will consider the channel that was used immediately before conversion, rather than channels used in the past day/week/month.
  • Position: This model gives priority to the first and last channel used before conversion. Anything in the middle gets less attribution.

The depressing part, though?

There’s no right answer here. The attribution model you pick largely depends on your sales cycle, your customers, and even what specific objective you’re trying to figure out.

For example, if you’re spending a ton on ads, you might want to see how the First Interaction looks. Especially when using social ads that often bring people into your ecosystem for the very first time.

In other cases? It would be a terrible choice.

The trick is to know what you’re solving for, first. Then working backwards.

Conclusion

Data is important. It’s huge.

YOOGE.

But, be careful.

Google Analytics is a marvelous, cost effective, game-changing tool.

However, it’s been known to lie a little from time-to-time. (Yes, we’re still talking about Google Analytics here.)

Remember that conversion results aren’t always spot on. Direct traffic data might not be correct. Vanity metrics aren’t everything. A/B results can fire off false positives. And last touch isn’t everything.

View original article here

Drill Down Into Key Segments to Understand and Improve Your Funnel

Here is an note on Drill Down Into Key Segments to Understand and Improve Your Funnel.

Be sure to read the full article and view the original source

The funnel has become a key part of the modern-day marketers toolkit. It’s the first report they peak at on Monday morning, and the last report they check before leaving for the weekend on a Friday.

All serious analytics tools have some version of a funnel report, with differing degrees of flexibility and features. Some are narrower, allowing for a limited number of use cases, while others are more full-featured with advanced conditions, date ranges, and advanced segmentation.

Kissmetrics has a Funnel Report of our own. It’s flexible and has a lot of great features that you can use right “out of the box”.

The Kissmetrics Activity Report is a bit of a natural extension of the Funnel Report. It’s great for segmenting into one or multiple event(s).

This post will show how marketers and growth teams can use the Funnel and Activity report in tandem to garner even greater insights through segmentation. Let’s see how.

Funnel Report: Identify Opportunities

The standard funnel use case is tracking the key steps from first visit to conversion. A funnel for a SaaS company may have these steps:

  1. Visited site – They visited your site but haven’t converted yet.
  2. Signed up for trial – Visitors signed up for a free trial of your product.
  3. Activated – Some product activation occurred. They installed the JavaScript, added a team member, etc.
  4. Billed – They decided they wanted to keep the product and started paying for it after their trial expired.

Dropoffs can occur anywhere in this funnel. Most sites get about a 3% conversion rate, so the biggest “dip” will be from 1-2. But if steps 2-3 also have a big dip, that could signal an issue with your onboarding or your marketing is getting unqualified people to signup.

An e-commerce funnel may look like this:

  1. Visited site – Same as the funnel above – they visited but haven’t converted.
  2. Viewed product – This may or may not be in most funnels, but it’s a necessary step in the funnel.
  3. Added product to cart – they showed enough interest to add a product to the cart.
  4. Purchased – they ordered the product(s).

Dropoffs in this funnel can occur in steps 3-4, and here it is important to “zoom in” with a funnel and view each micro step that occurs between 3-4. There are typically a lot of steps that customers have go through after they add an item to the cart and before they purchase, so it may help to create a funnel just for this flow.

Example

You’re the marketing manager for a SaaS company, and it’s Friday afternoon and you’re going through your analytics data for the past week. You pull up the Funnel Report and spot your opportunity:

This really isn’t a bad funnel. Most SaaS companies would love a 7%+ conversion rate. And further down the funnel, there’s a solid conversion rate to activating the product (these conversion rates will depend on the complexity of the product and the conditions for the Activated event). The amount of trial users that upgrade is healthy, at 7.7%. A better trial experience, attracting the right customers, achieving product/market fit, and addressing the biggest issues trial customers face can improve this conversion step.

But, there’s always room for improvement.

For now, we’ll focus on improving our signups. Most conversion rates are improved by a/b testing, but in this post we’ll drill down into this signed up event.

Activity Report: Drilldown to Understand What’s Driving the Dropoffs

To use the Activity Report, we’ll simply select the date range and event. Since we want to pick up from our Funnel Report, we’ll select the Signed up event and use the same date range. We’ll run the report and this is what we get:

This shows signups per day for that week. We can see that it peaks in the middle of the week, and then falls off, reaching its low on Friday.

Now we’ll drilldown to see what’s driving these numbers. While we have many properties, there are only a few properties that could be causing this. Since we’re concerning ourselves with a marketing event (a person signing up), we’ll use a marketing property. I like our Channel property. It splits visitors into 6 different channels depending on where they came from.

An extension of Channel is Channel: Origin. This lists the channel and the corresponding URL or Campaign Name. If a visitor came from nytimes.com then they’ll have the Channel: Origin is Referrer: nytimes.com.

Now that we have that, we’ll use the Channel: Origin property as a “first step” to breakdown the signups for that week.

Here’s what we get:

The bottom part of this image are the top 3 channel: origins. We see organic search is where most people came from, then AdWords, and the third is direct. The graph is the visualization – showing us how these interact with each other.

Just at this level, we can already see that our signups are directly correlated with how much organic search traffic we get. If you scroll back up, you’ll see that overall signups and signups from organic: google are tied together.

Underneath this section, we get the numbers:

We see there are 103 different channel: origins. We’re only looking at our first few so we can get an idea of what is sending us signups.

Let’s evaluate the Copyblogger referrer further. To do that, we’ll click the Add value and add that property:

We’ll click the Copyblogger option and get the visualization:

Compared to our others, it’s not adding much. Our first three channels are the ones that are really bringing home the bacon. And with organic being our top channel, we know that we need to keep our organic traffic flowing – otherwise our business will be impacted. This can be considered a risk factor to the business.

Conclusion

View original article here

Cooling Comes In From The Cold At Climate Week NYC

check out this post on Cooling Comes In From The Cold At Climate Week NYC

Economic and social development and the environment have to live together; you can no longer have one at the expense of the other. Rather our aim has to be a world where everyone can live well and within the sustainable limits of our planet; cold sits at the nexus of this challenge.

Effective refrigeration could help to preserve essential food and medicine, make better use of land and water. It underpins industry and economic growth, and could provide a ladder out of rural poverty. Yet increased cooling will create massive demand for energy and, unless clean and sustainable cooling solutions can be rolled out, this will cause high levels of pollution. The world must not solve a social crisis by creating an environmental catastrophe.

Luckily, cooling is coming in from the cold. After many years on the side lines of the energy debate, the importance of artificial cooling to modern civilization, and the damage it causes to the environment and health, is at last beginning to be recognised. A two-day work shop – Cooling for All, a new initiative led by Sustainable Energy for All – brought together a strong leadership team in New York to start to work out how to move cooling to the centre of the debate and how we embed growing cooling demands that can reach everyone within a clean energy transition.

Clean cold – sustainable, affordable artificial cooling with minimal global warming or environmental impact – is nothing less than critical to environmental and business sustainability worldwide. A report published by the University of Birmingham Energy Institute earlier this year was the first to point out that achieving all 17 of the UN’s Sustainable Development Goals (‘Global Goals’) would depend to a greater or lesser extent on developing clean cooling technologies – and for many Goals, clean cold would be vital. http://www.birmingham.ac.uk/Documents/college-eps/energy/Publications/Clean-Cold-and-the-Global-Goals.pdf

One problem is that when people talk about energy, they often mean electricity, and when they talk about energy storage, they mean batteries. This blurring of concepts matters because it fails to recognise some basic energy facts-of-life: that a large slice of our consumption comes in the form of thermal energy; that one of the fastest growing sources of energy demand over the next twenty years will be for cooling; – and that cooling would often be better served by energy carriers other than electricity and batteries.

If cooling is to be sustainable, we don’t simply need more efficient air-conditioners and fridges, but a fundamental overhaul of the way cooling is provided. This demands a new needs-driven, system-level approach to understand the size and location of the thermal, waste and wrong-time energy resources and the novel energy vectors, thermal stores, clean cooling technologies and new business models to integrate those resources optimally with various cooling loads.

view original

test misa

test

1 st

2 st

3 st

4 st

8st

retretret

10 st